suiss/ui · Chart
Area Chart Interactive
A stock price chart with time-range toggles, a scrubbing cursor that updates the header, and animated transitions between ranges.
Area Chart Interactive is an open-source chart from suiss/ui for React, React Native, SwiftUI and Jetpack Compose. The @esuiss/ui CLI copies its source into your project, so you own the code.
A stock-style price chart with range toggles from one day to five years. Scrubbing the plot updates the price, change and date in the header, and switching ranges morphs the line into its new shape. Use it as a starting point for financial or any time-series dashboard where readers drill into time ranges.
Installation
CLI
Works in any project with a components.json. See Installation for the one-line registry setup. Or use the suiss/ui CLI:
Manual
- Install the dependencies:
-
Add the pieces it builds on: Card, Chart, Toggle Group.
-
Copy the source into
components/charts/area-chart-interactive.tsx:
- Update the import paths to match your project.
Usage
The demo generates prices from a seeded random series; replace the generate function with your own fetch or data per range, keeping one price and one label per point. Edit RANGES to change the available toggles and their captions. The stats row under the chart, including the volume figure, is static and should be wired to your data.
Notes
The line turns green or red depending on whether the price at the cursor is above or below the opening price, so the color can flip while scrubbing. The morph animation is skipped when the user prefers reduced motion, and on touch devices the header returns to the latest price when the finger lifts. There is no floating tooltip; all readouts live in the header.
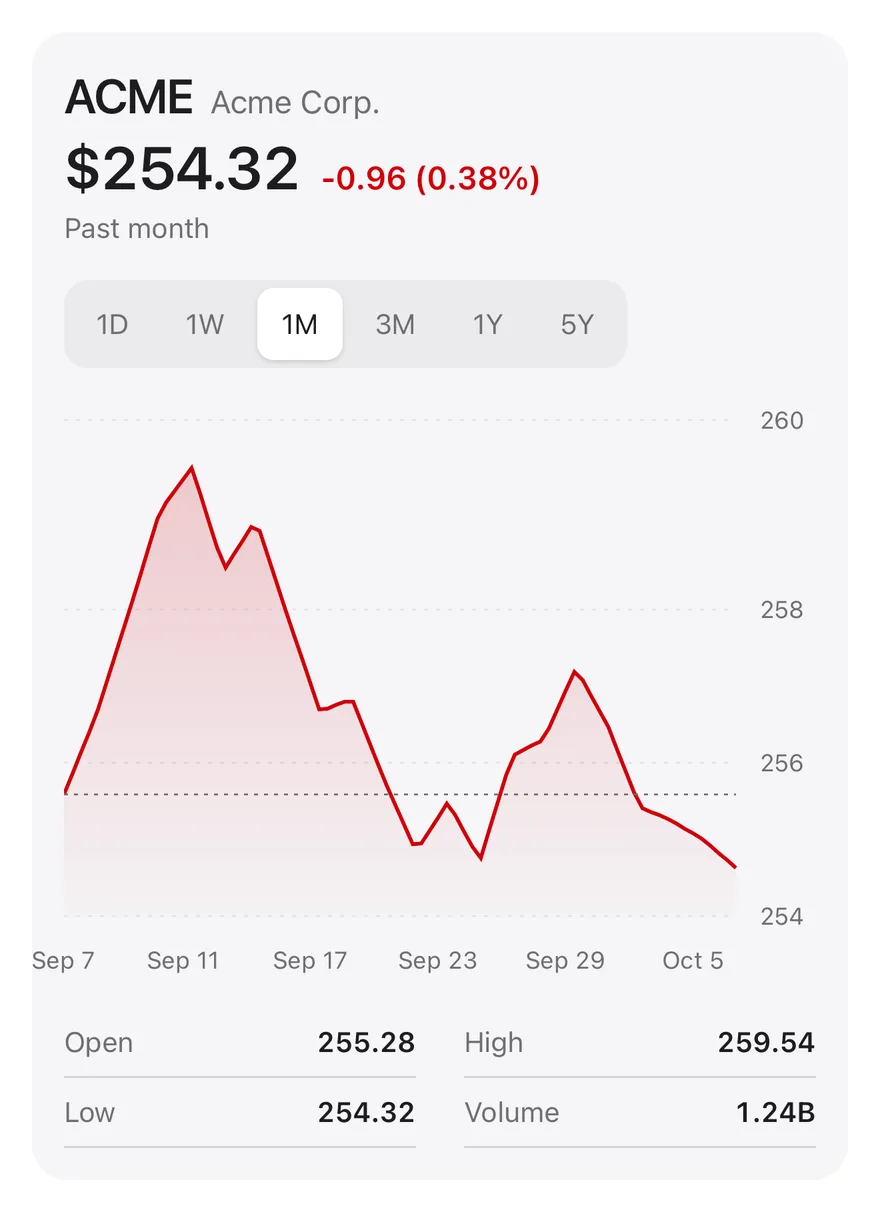
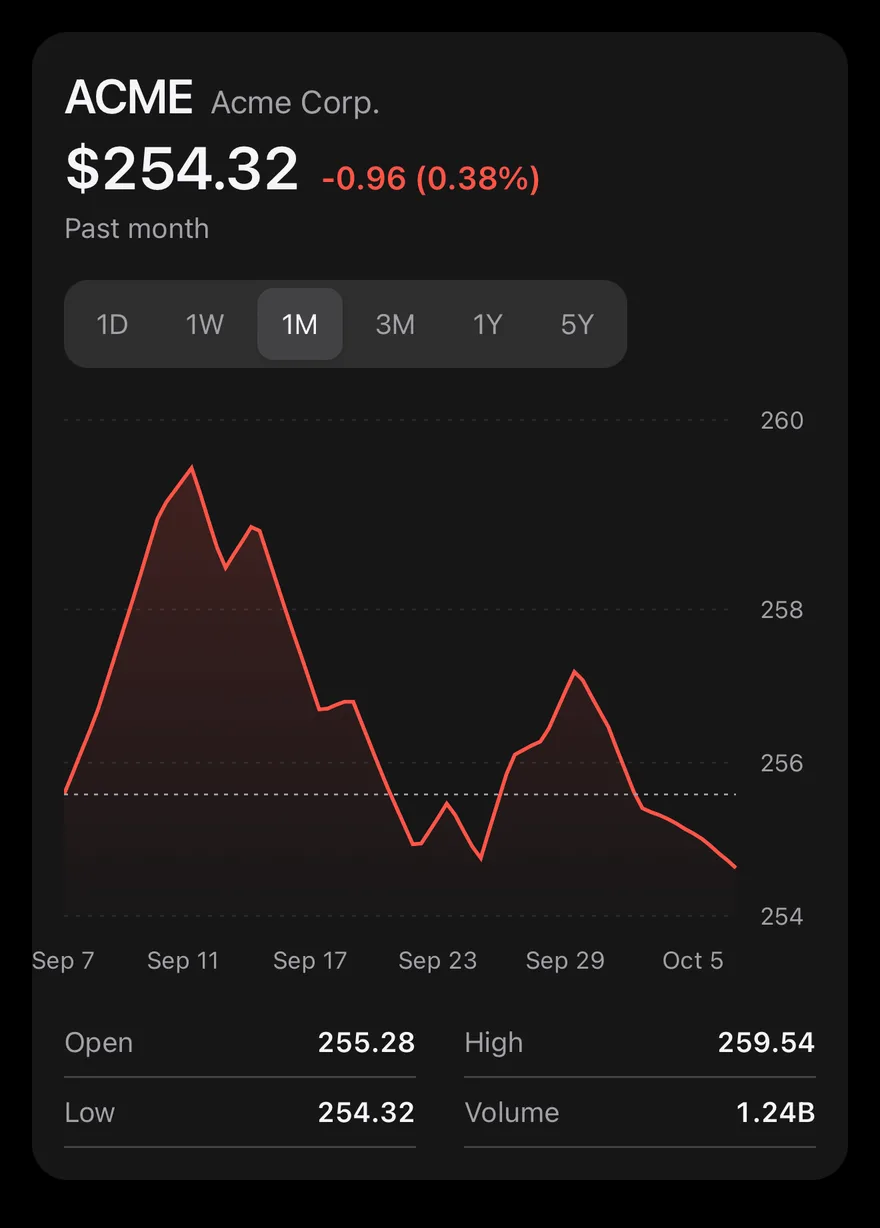
One price series drawn as a linear area with a fading gradient, a value axis on the right and a dashed ReferenceLine at the opening price. A ToggleGroup switches between 1D, 1W, 1M, 3M, 1Y and 5Y. Touching the plot reports the point through onActiveIndexChange, and the header updates the price, change and date for that point. The area turns green or red depending on whether the price is up or down, and open, high, low and volume sit below the chart. The area sets isAnimationActive={false}, so it draws without the enter animation and switches ranges instantly.
Installation
The CLI also adds what it builds on: Card, Chart, Text, Toggle Group.
Manual
- Install the dependencies:
-
Add the pieces it builds on: Card, Chart, Text, Toggle Group.
-
Copy the source into
components/charts/area-chart-interactive.tsx:
- Update the import paths to match your project.
- Install the dependencies:
-
Add the pieces it builds on: Card, Chart, Text, Toggle Group.
-
Copy the source into
components/charts/area-chart-interactive.tsx:
- Update the import paths to match your project.
-
Add the pieces it builds on: Card, Chart, Text, Toggle Group.
-
Copy the source into
components/charts/area-chart-interactive.tsx:
- Update the import paths to match your project.
-
Target iOS 17 or later.
-
Add the Swift package to your app:
- Copy the theme files every view uses:
- Copy the source and every file it uses:
- Add the files to your app target.
- Set
minSdkto 24 or higher and add the dependencies:
- Copy the theme files every view uses:
- Copy the source and every file it uses:
- Update the
com.esuiss.uipackage names to match your project.
Usage
Replace generate() with your price history for each range, and set the symbol, company name and LAST_PRICE. Volume values are hard-coded in stats. The component takes no props.