suiss/ui · Chart
Radial Chart Gauge
A 240-degree gauge arc showing an air quality reading with its value and rating below the center.
Radial Chart Gauge is an open-source chart from suiss/ui for React, React Native, SwiftUI and Jetpack Compose. The @esuiss/ui CLI copies its source into your project, so you own the code.
A gauge-style arc that opens at the bottom, showing a single reading with its value and rating in the center. Use it for scores with a known range, such as air quality, health scores or credit utilization.
Installation
CLI
Works in any project with a components.json. See Installation for the one-line registry setup. Or use the suiss/ui CLI:
Manual
- Install the dependencies:
-
Copy the source into
components/charts/radial-chart-gauge.tsx:
- Update the import paths to match your project.
Usage
Set the reading in chartData and the scale on PolarAngleAxis through its domain. Update the number and rating text in the center overlay, which are not read from the data. Change the color in chartConfig, or pick it from the value if the color should signal good and bad ranges.
Notes
There is no tooltip and the center text is hard-coded, so keep it in sync with the value you pass.
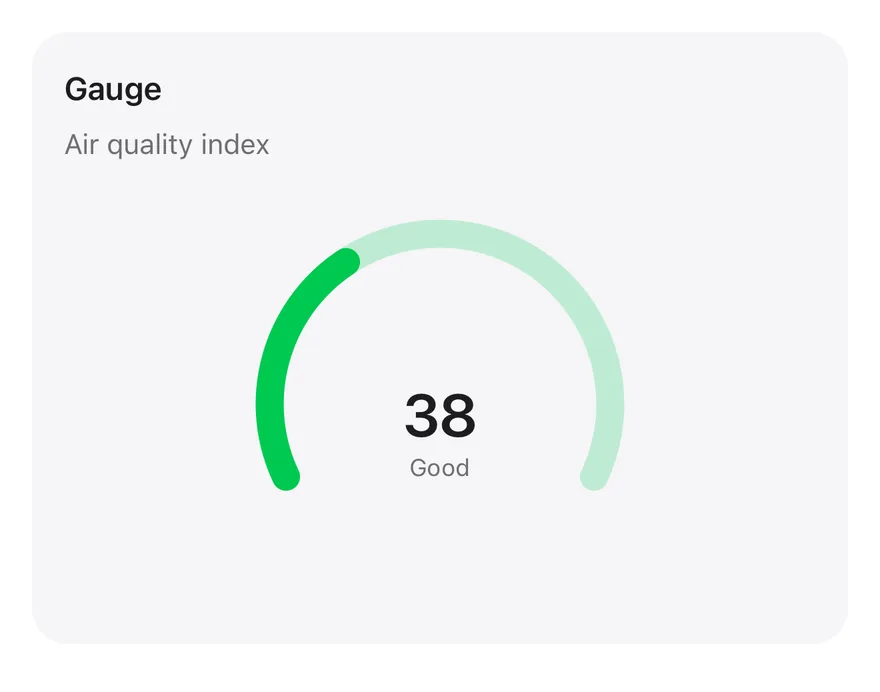
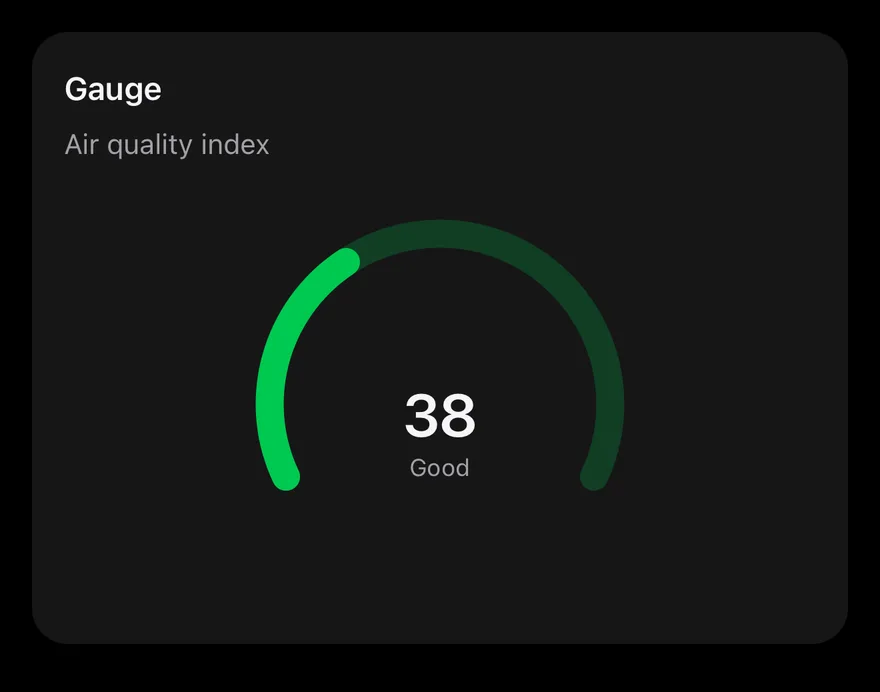
A RadialBarChart drawn from 210 to -30 degrees, with a single value on a 0 to 100 PolarAngleAxis and a tinted track behind it. The number and its rating are Text layered over the arc. Nothing is interactive.
Installation
The CLI also adds what it builds on: Card, Chart, Text.
Manual
-
Target iOS 17 or later.
-
Copy the theme files every view uses:
- Copy the source and every file it uses:
- Add the files to your app target.
- Set
minSdkto 24 or higher and add the dependencies:
- Copy the theme files every view uses:
- Copy the source and every file it uses:
- Update the
com.esuiss.uipackage names to match your project.
Usage
Change the value in chartData (0 to 100) and the centered text to match it; the label and color live in chartConfig. The component takes no props.