suiss/ui · Chart
Area Chart Range
A heart-rate band showing each hour's low-to-high range as a shaded area with an average line through it.
Area Chart Range is an open-source chart from suiss/ui for React, React Native, SwiftUI and Jetpack Compose. The @esuiss/ui CLI copies its source into your project, so you own the code.
A health-style heart-rate card that shades each hour's low-to-high range and draws the average as a line through the band. Use it for any metric where the spread matters as much as the typical value, such as temperatures or response times.
Installation
CLI
Works in any project with a components.json. See Installation for the one-line registry setup. Or use the suiss/ui CLI:
Manual
- Install the dependencies:
-
Copy the source into
components/charts/area-chart-range.tsx:
- Update the import paths to match your project.
Usage
Feed in one record per period with a two-number range array and an average value; the header's overall low and high are derived from the data. Adjust the value axis domain and ticks to fit your range, and change the unit text in the tooltip and header. Set both colors in chartConfig.
Notes
The value axis has a fixed domain, so readings outside it get clipped until you widen it. Focus the plot and use the arrow keys to move the tooltip between hours.
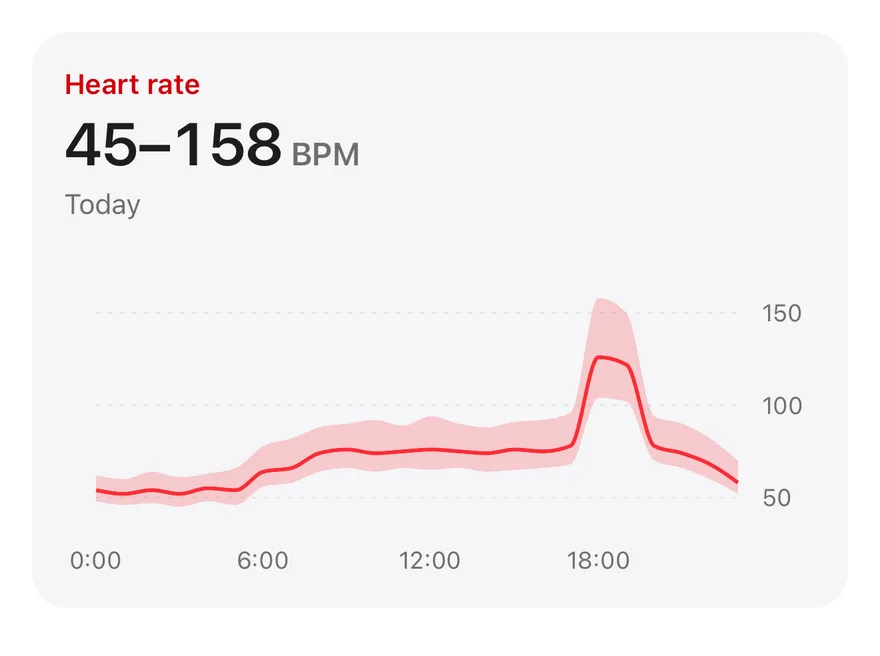
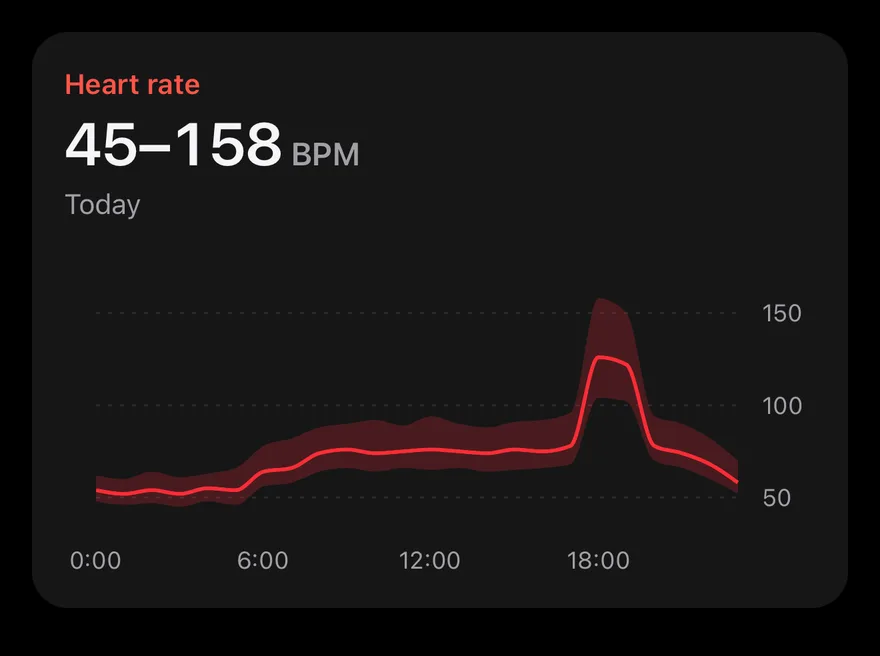
A ComposedChart that pairs a range Area, filled between each hour's low and high reading, with a Line for the hourly average. The header shows the day's lowest and highest values in BPM, and the tooltip formats both the range and the average with a custom row built from Text.
Installation
The CLI also adds what it builds on: Card, Chart, Text.
Manual
-
Target iOS 17 or later.
-
Copy the theme files every view uses:
- Copy the source and every file it uses:
- Add the files to your app target.
- Set
minSdkto 24 or higher and add the dependencies:
- Copy the theme files every view uses:
- Copy the source and every file it uses:
- Update the
com.esuiss.uipackage names to match your project.
Usage
Replace the readings array with [low, high, average] tuples for each hour; the header range and the chart data are derived from it. Adjust the YAxis domain and ticks to fit your values. The component takes no props.