suiss/ui · Chart
Area Chart Stacked
Two areas stacked on top of each other so the top edge shows the combined total, with a legend.
Area Chart Stacked is an open-source chart from suiss/ui for React, React Native, SwiftUI and Jetpack Compose. The @esuiss/ui CLI copies its source into your project, so you own the code.
Two series stacked so the top edge shows the combined total, with a legend underneath. Use it when both the total and each part's contribution matter, as in desktop plus mobile traffic.
Installation
CLI
Works in any project with a components.json. See Installation for the one-line registry setup. Or use the suiss/ui CLI:
Manual
- Install the dependencies:
-
Copy the source into
components/charts/area-chart-stacked.tsx:
- Update the import paths to match your project.
Usage
Replace chartData and rename the series keys in the data, both areas and chartConfig. Give every series the same stackId to stack them; the first one declared sits at the bottom. The legend picks up labels and colors from the config automatically.
Notes
The tooltip follows the cursor or the arrow keys once the plot has focus.
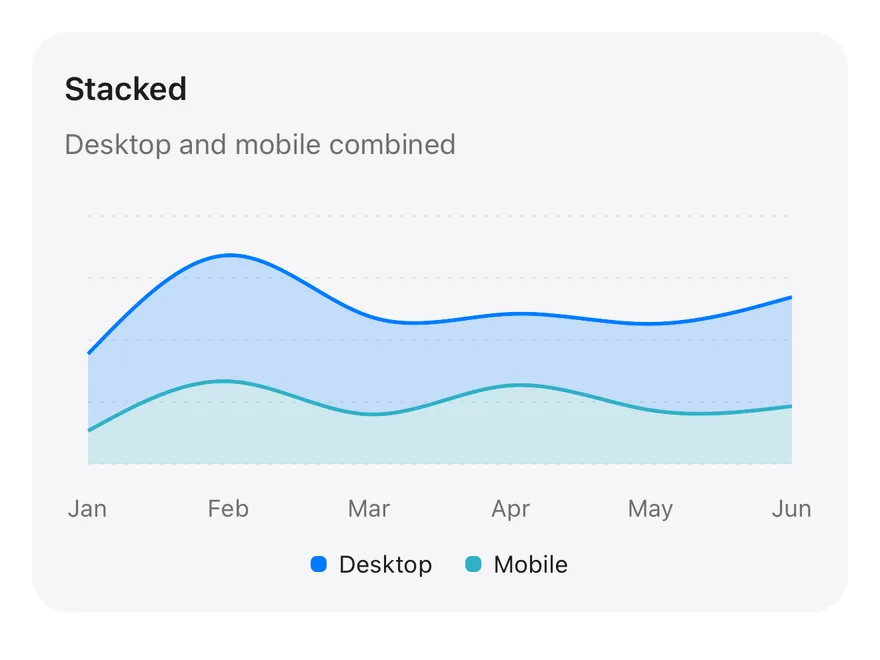
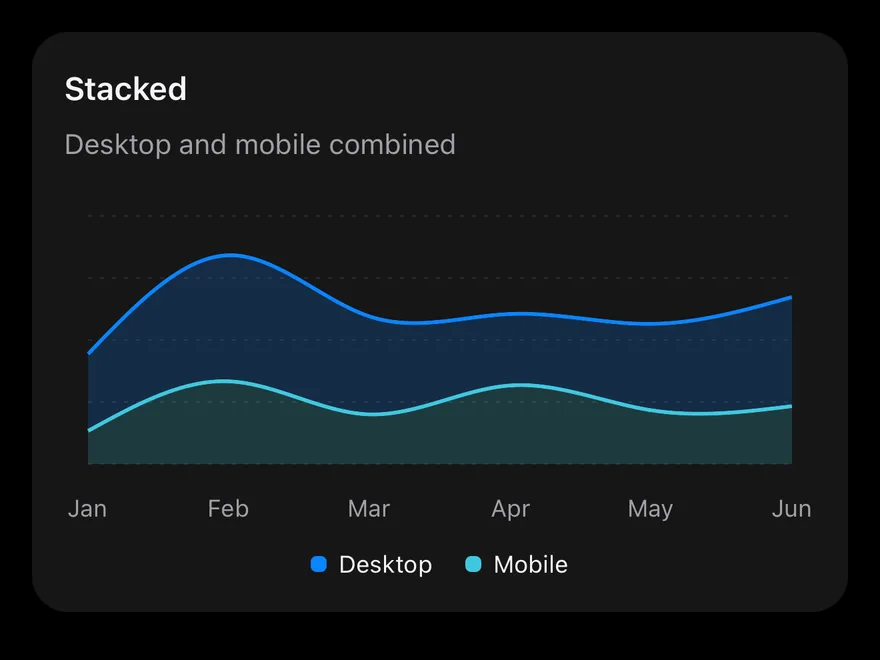
Desktop and mobile areas are stacked on top of each other with the same stackId, so the top edge shows the combined total. A legend below the plot names both series, and the tooltip lists each value with a dot indicator.
Installation
The CLI also adds what it builds on: Card, Chart.
Manual
-
Target iOS 17 or later.
-
Copy the theme files every view uses:
- Copy the source and every file it uses:
- Add the files to your app target.
- Set
minSdkto 24 or higher and add the dependencies:
- Copy the theme files every view uses:
- Copy the source and every file it uses:
- Update the
com.esuiss.uipackage names to match your project.
Usage
Replace chartData with your records and change each dataKey to match your fields. Add, rename or recolor series in chartConfig; the legend picks the changes up. The component takes no props.