suiss/ui · Chart
Bar Chart Hourly
Twenty-four thin bars of screen time per hour, with a dashed line marking the hourly average.
Bar Chart Hourly is an open-source chart from suiss/ui for React, React Native, SwiftUI and Jetpack Compose. The @esuiss/ui CLI copies its source into your project, so you own the code.
A screen-time card with 24 thin hourly bars, a total in the header and a dashed line at the hourly average. Use it for any day-at-a-glance metric with many small periods.
Installation
CLI
Works in any project with a components.json. See Installation for the one-line registry setup. Or use the suiss/ui CLI:
Manual
- Install the dependencies:
-
Copy the source into
components/charts/bar-chart-hourly.tsx:
- Update the import paths to match your project.
Usage
Replace the 24 values in chartData with your own per-hour numbers; the total and the average line are computed from them. Change the axis ticks to label different hours, and update the minute unit in the axis, tooltip and header if you measure something else.
Notes
With 24 narrow bars, the tooltip is the most reliable way to read a single hour. Focus the chart and use the arrow keys to step through the hours.
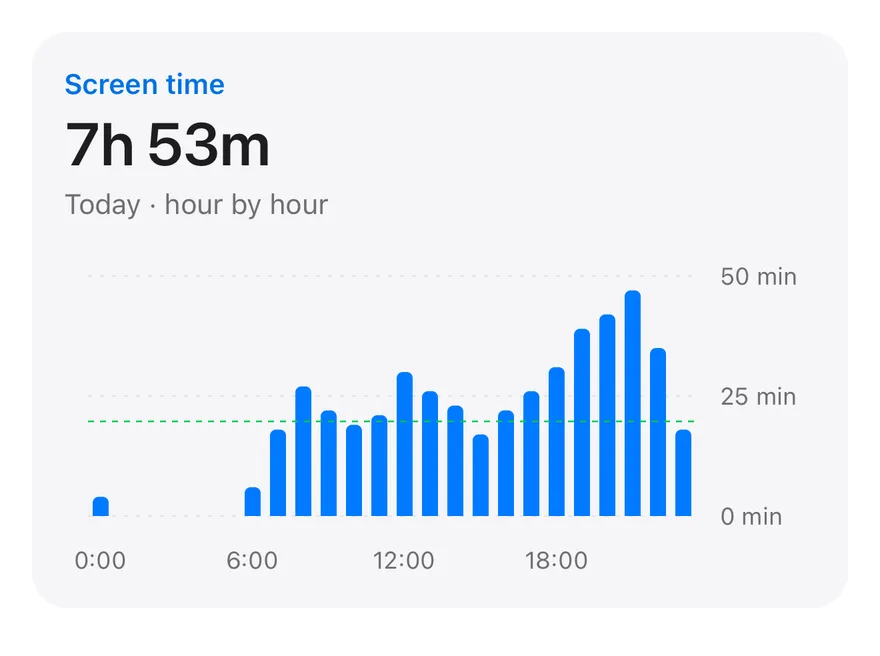
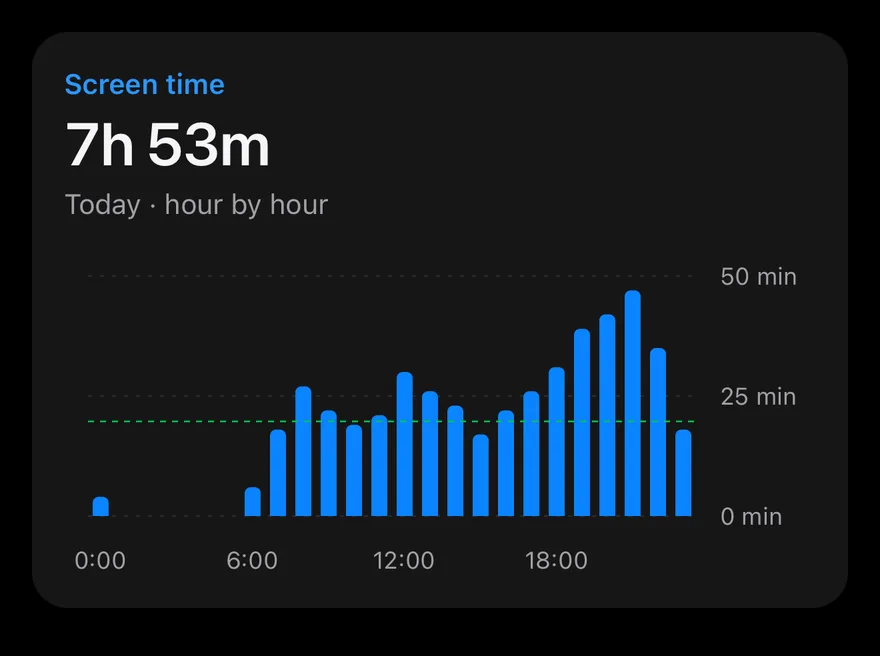
Thin bars show minutes for each hour of the day, with ticks every six hours and a value axis in minutes on the right. A ReferenceLine marks the hourly average, and the header shows the day's total in hours and minutes. The tooltip formats the hour and the minutes.
Installation
The CLI also adds what it builds on: Card, Chart, Text.
Manual
-
Target iOS 17 or later.
-
Copy the theme files every view uses:
- Copy the source and every file it uses:
- Add the files to your app target.
- Set
minSdkto 24 or higher and add the dependencies:
- Copy the theme files every view uses:
- Copy the source and every file it uses:
- Update the
com.esuiss.uipackage names to match your project.
Usage
Replace the 24 values in chartData with your hourly minutes; the total and average are calculated from it. The component takes no props.