suiss/ui · Chart
Bar Chart Range
A weather forecast where each horizontal pill spans the day's low and high on a shared gradient scale.
Bar Chart Range is an open-source chart from suiss/ui for React, React Native, SwiftUI and Jetpack Compose. The @esuiss/ui CLI copies its source into your project, so you own the code.
A weather-app forecast where each horizontal pill spans a day's low to high temperature against a shared scale, with a colored gradient fill and the high on the right. Use floating range bars like these whenever each item has a minimum and a maximum.
Installation
CLI
Works in any project with a components.json. See Installation for the one-line registry setup. Or use the suiss/ui CLI:
Manual
- Install the dependencies:
-
Copy the source into
components/charts/bar-chart-range.tsx:
- Update the import paths to match your project.
Usage
Give each record a label, a low and a high; the chart derives the two-value range from them. Set the hidden value axis domain to cover your full range so pills line up across rows. Edit the gradient stops in the defs block to change the colors.
Notes
The gradient runs across each pill rather than across the whole scale, so every pill shows the full color ramp regardless of its temperatures. Only the high is printed beside the bars; the low is available in the tooltip.
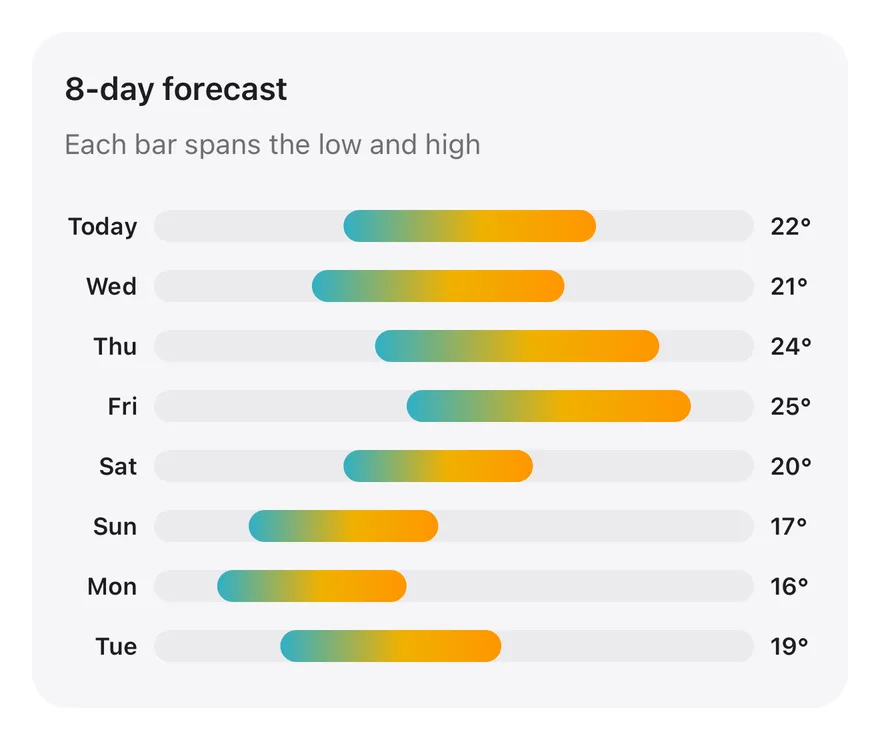
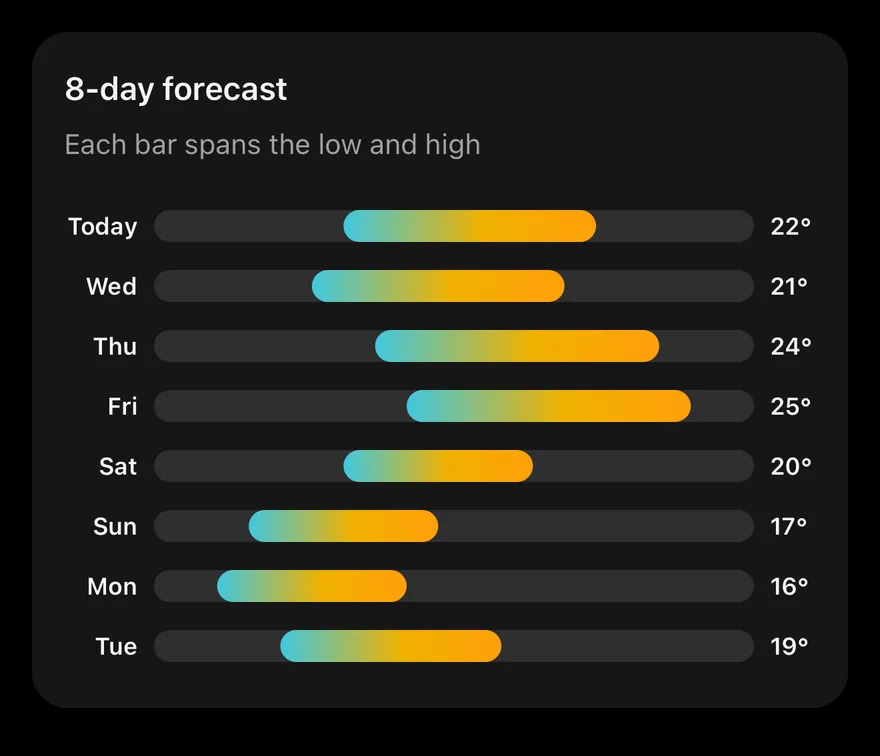
A horizontal BarChart whose range values are [low, high] pairs, so each bar floats between the two temperatures. Bars use a teal-to-orange gradient over a full-width track, day names sit on the left and highs on the right. The tooltip shows the range in degrees.
Installation
The CLI also adds what it builds on: Card, Chart, Text.
Manual
-
Target iOS 17 or later.
-
Copy the theme files every view uses:
- Copy the source and every file it uses:
- Add the files to your app target.
- Set
minSdkto 24 or higher and add the dependencies:
- Copy the theme files every view uses:
- Copy the source and every file it uses:
- Update the
com.esuiss.uipackage names to match your project.
Usage
Replace chartData with your days and low and high values; the range pair is derived from them. Adjust the hidden XAxis domain to fit your temperature range. The component takes no props.