suiss/ui · Chart
Line Chart Labeled
A single line with a dot and a printed value at every point, and no grid.
Line Chart Labeled is an open-source chart from suiss/ui for React, React Native, SwiftUI and Jetpack Compose. The @esuiss/ui CLI copies its source into your project, so you own the code.
A single smooth line with a dot and a printed value at every point and no grid. Choose it for short series where readers want the exact numbers without hovering.
Installation
CLI
Works in any project with a components.json. See Installation for the one-line registry setup. Or use the suiss/ui CLI:
Manual
- Install the dependencies:
-
Copy the source into
components/charts/line-chart-labeled.tsx:
- Update the import paths to match your project.
Usage
Replace chartData, point each dataKey at your fields and set the label and color in chartConfig. Move the value labels with the position prop on LabelList, and raise the chart's top margin if labels get clipped.
Notes
Labels overlap quickly on long or dense series; keep this variant to a dozen points or fewer.
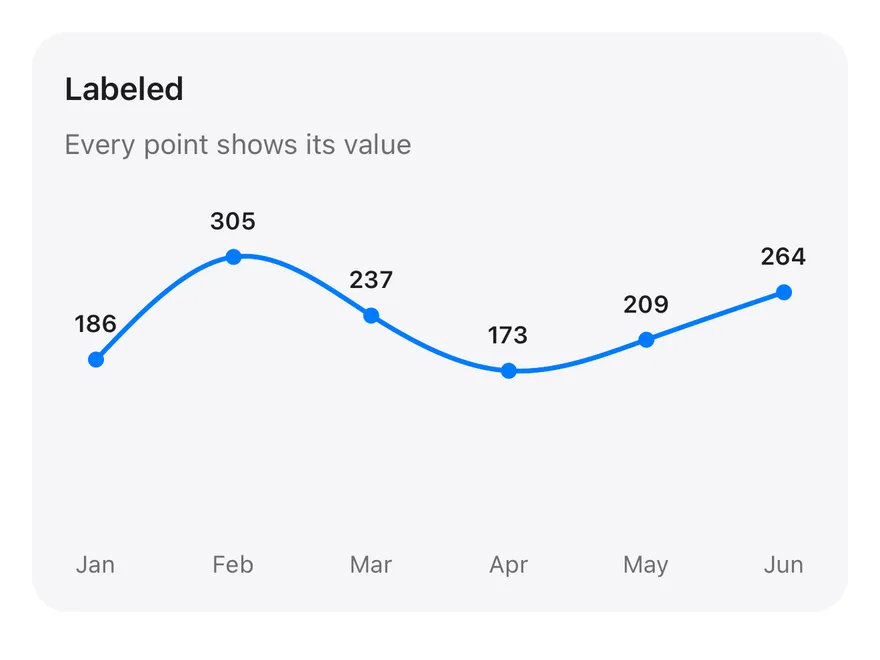
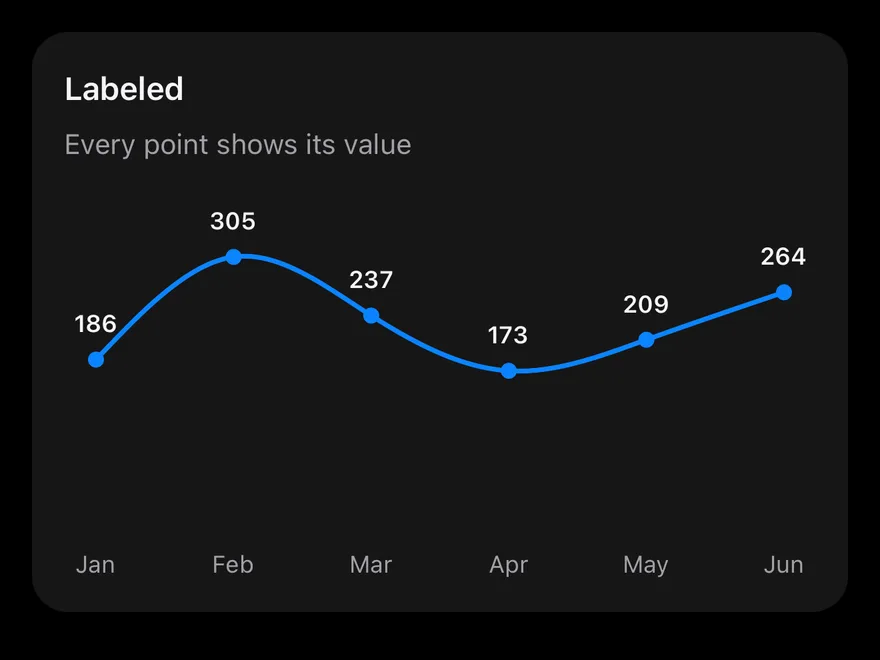
One natural curve with dots on each month and a LabelList above every point, so values are readable without touching the chart. There is no grid; a month axis and a tooltip remain.
Installation
The CLI also adds what it builds on: Card, Chart.
Manual
-
Target iOS 17 or later.
-
Copy the theme files every view uses:
- Copy the source and every file it uses:
- Add the files to your app target.
- Set
minSdkto 24 or higher and add the dependencies:
- Copy the theme files every view uses:
- Copy the source and every file it uses:
- Update the
com.esuiss.uipackage names to match your project.
Usage
Replace chartData with your records and change each dataKey to match your fields. Change position and offset on the LabelList to move the labels. The component takes no props.