suiss/ui · Chart
Area Chart Sparkline
A watchlist with a tiny gradient area chart beside each price, colored by whether the stock is rising or falling.
Area Chart Sparkline is an open-source chart from suiss/ui for React, React Native, SwiftUI and Jetpack Compose. The @esuiss/ui CLI copies its source into your project, so you own the code.
A watchlist where each row pairs a stock's name and price with a tiny gradient area chart, tinted green when rising and red when falling. Use sparklines like these inside lists and tables where a full chart would be too much.
Installation
CLI
Works in any project with a components.json. See Installation for the one-line registry setup. Or use the suiss/ui CLI:
Manual
- Install the dependencies:
-
Copy the source into
components/charts/area-chart-sparkline.tsx:
- Update the import paths to match your project.
Usage
Replace the stocks array and the demo series generator with your own symbols and price history. The tint follows the sign of each row's change, and the two colors live in chartConfig. Resize the sparkline through the class names on its ChartContainer.
Notes
Sparklines are hidden from assistive technology and have no tooltip or keyboard support, so keep the price and percentage text next to them. Animation is off so long lists render without motion.
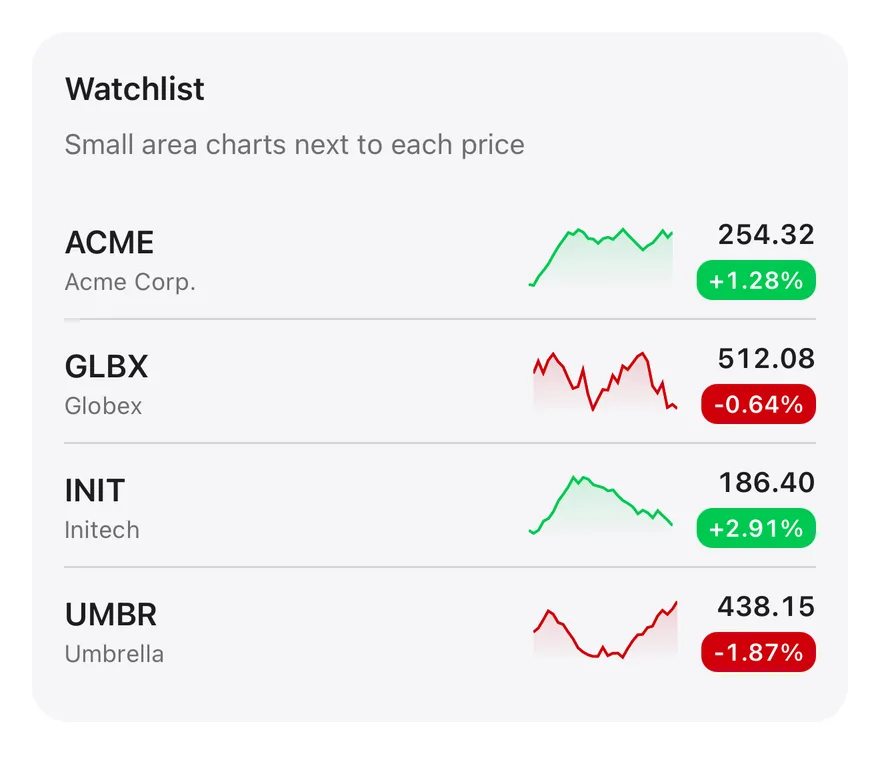
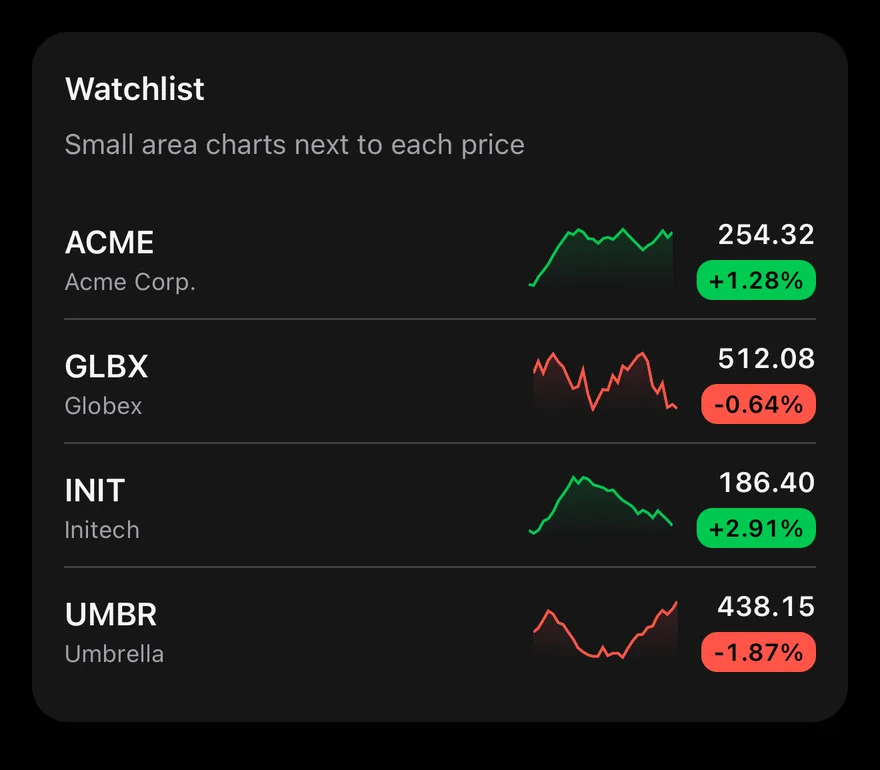
Each row shows a symbol and company name, a tiny area chart without axes, the price and a colored badge with the percentage change. The sparkline turns green when the change is positive and red when it is negative, using the up and down colors in chartConfig. The charts are hidden from screen readers because the row text already carries the values. Each sparkline sets isAnimationActive={false} and draws without the enter animation.
Installation
The CLI also adds what it builds on: Card, Chart, Text.
Manual
-
Target iOS 17 or later.
-
Copy the theme files every view uses:
- Copy the source and every file it uses:
- Add the files to your app target.
- Set
minSdkto 24 or higher and add the dependencies:
- Copy the theme files every view uses:
- Copy the source and every file it uses:
- Update the
com.esuiss.uipackage names to match your project.
Usage
Replace the stocks array with your own symbols, prices and changes, and swap the generated series data for real price history. The component takes no props.