suiss/ui · Block
Dash Analytics
An app analytics dashboard with a metric switcher, an interactive area chart, and a regional breakdown.
Dash Analytics is an open-source block from suiss/ui for React, React Native, SwiftUI and Jetpack Compose. The @esuiss/ui CLI copies its source into your project, so you own the code.
An analytics dashboard for apps: pick a metric, read its current value and growth, and hover the 12-week area chart to see any week's figure in the headline. A By region list below breaks the metric down by share. The app list sits in a Sidebar that collapses to icons on desktop and opens as a sheet from the trigger on mobile. Start here for product analytics, traffic or revenue reports.
Installation
CLI
Works in any project with a components.json. See Installation for the one-line registry setup. Or use the suiss/ui CLI:
Manual
- Install the dependencies:
-
Add the pieces it builds on: Chart, Item, Sidebar, Toggle Group.
-
Copy the source into
components/blocks/dash-analytics.tsx:
- Update the import paths to match your project.
Usage
Replace metrics with your series; each metric has a label, unit, current value and 12 weekly data points. regions holds each region's share, and apps and items fill the navigation. The sample fakes per-app numbers by scaling the first app's data and computes growth on the fly, so load real figures per app from your analytics source.
Notes
The headline value is announced as you move through the chart, and the chart supports keyboard navigation.
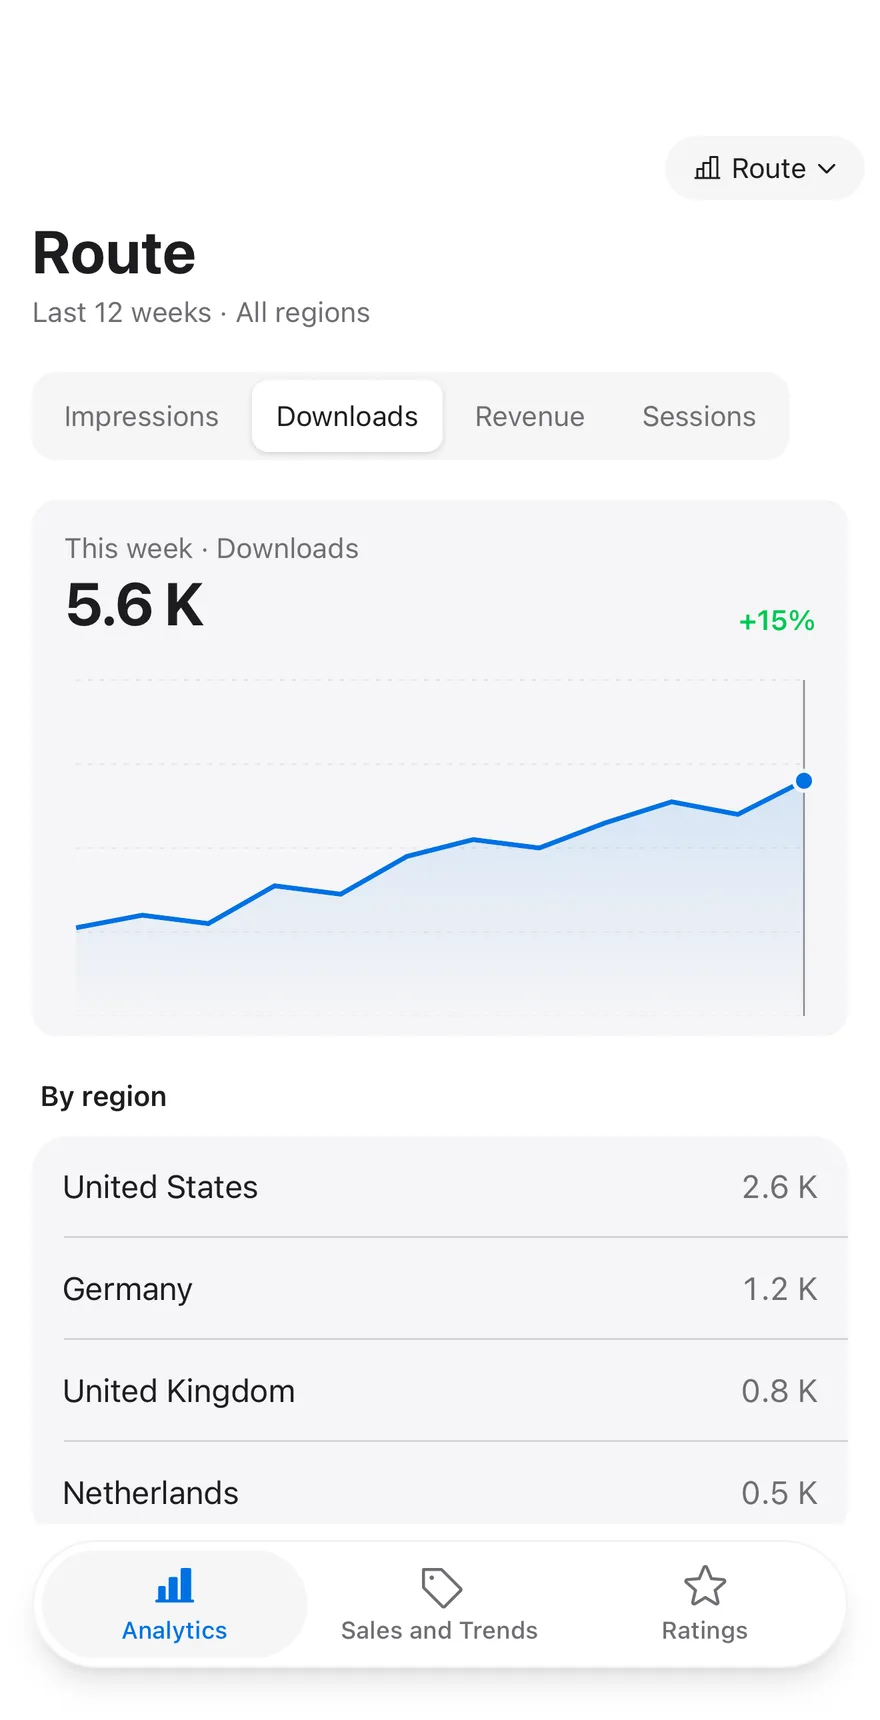
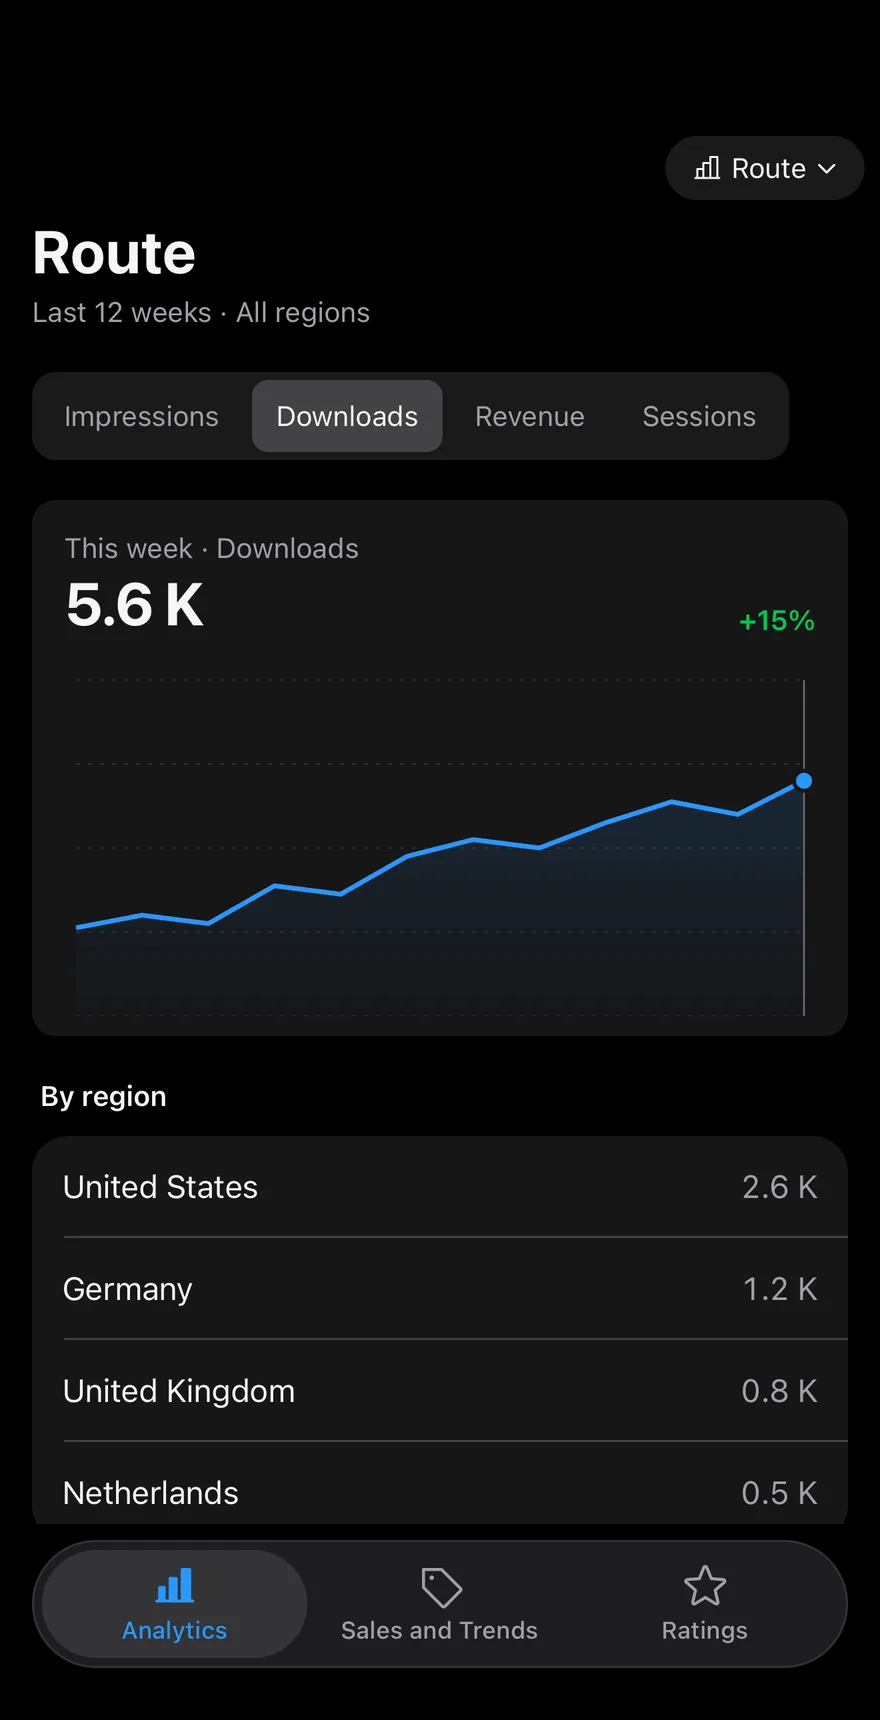
Composes Screen, Header, DropdownMenu for picking the app, ToggleGroup, the AreaChart from Chart, Item rows and TabBar. Switching the metric or app redraws the chart, and dragging across the chart updates the headline value for that week. The other tabs show a placeholder section.
Installation
The CLI also adds what it builds on: Button, Chart, Dropdown Menu, Header, Icon, Item, Screen, Tab Bar, Text, Toggle Group.
Manual
- Install the dependencies:
-
Add the pieces it builds on: Button, Chart, Dropdown Menu, Header, Icon, Item, Screen, Tab Bar, Text, Toggle Group.
-
Copy the source into
components/blocks/dash-analytics.tsx:
- Update the import paths to match your project.
- Install the dependencies:
-
Add the pieces it builds on: Button, Chart, Dropdown Menu, Header, Icon, Item, Screen, Tab Bar, Text, Toggle Group.
-
Copy the source into
components/blocks/dash-analytics.tsx:
- Update the import paths to match your project.
- Install the dependencies:
-
Add the pieces it builds on: Button, Chart, Dropdown Menu, Header, Icon, Item, Screen, Tab Bar, Text, Toggle Group.
-
Copy the source into
components/blocks/dash-analytics.tsx:
- Update the import paths to match your project.
-
Target iOS 17 or later.
-
Add the Swift package to your app:
- Copy the theme files every view uses:
- Copy the source and every file it uses:
- Add the files to your app target.
- Set
minSdkto 24 or higher and add the dependencies:
- Copy the theme files every view uses:
- Copy the source and every file it uses:
- Update the
com.esuiss.uipackage names to match your project.
Usage
Replace apps, metrics and regions with your analytics data. Pass onAppChange, onMetricChange and onNavigate to sync the selections with your app.