# Radial Chart Text
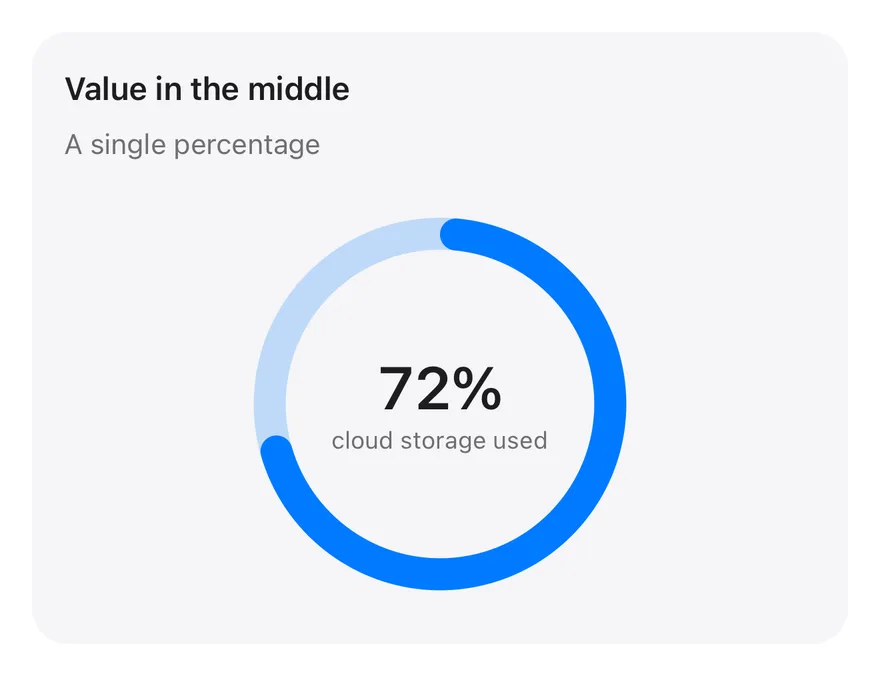
A single full-circle progress ring with a percentage and caption centered inside.
Radial Chart Text is an open-source chart from suiss/ui for React, React Native, SwiftUI and Jetpack Compose. The @esuiss/ui CLI copies its source into your project, so you own the code.
Source: https://ui.suiss.app/docs/charts/radial-chart-text
**React**
**Example**
```tsx title="components/charts/radial-chart-text.tsx"
"use client"
import { PolarAngleAxis, RadialBar, RadialBarChart } from "recharts"
import {
Card,
CardContent,
CardDescription,
CardHeader,
CardTitle,
} from "@/components/ui/card"
import { type ChartConfig, ChartContainer } from "@/components/ui/chart"
const chartData = [{ name: "value", value: 72, fill: "var(--color-value)" }]
const chartConfig = {
value: { label: "Used", color: "var(--chart-1)" },
} satisfies ChartConfig
export function RadialChartText() {
return (
Value in the middle
A single percentage
)
}
```
A single full-circle progress ring with a percentage and caption centered inside. Use it for one headline ratio, such as storage used or a completion rate.
## Installation
### CLI
```bash title="Terminal"
npx shadcn@latest add @esuiss/radial-chart-text
```
Works in any project with a `components.json`. See [Installation](https://ui.suiss.app/docs/installation#add-components) for the one-line registry setup. Or use the suiss/ui CLI:
```bash title="Terminal"
npx @esuiss/ui@latest add charts radial-chart-text
```
### Manual
1. Install the dependencies:
```bash title="Terminal"
npm install recharts
```
2. Add the pieces it builds on: [Card](https://ui.suiss.app/docs/components/card), [Chart](https://ui.suiss.app/docs/components/chart).
3. Copy the source into `components/charts/radial-chart-text.tsx`:
```tsx title="components/charts/radial-chart-text.tsx"
"use client"
import { PolarAngleAxis, RadialBar, RadialBarChart } from "recharts"
import {
Card,
CardContent,
CardDescription,
CardHeader,
CardTitle,
} from "@/components/ui/card"
import { type ChartConfig, ChartContainer } from "@/components/ui/chart"
const chartData = [{ name: "value", value: 72, fill: "var(--color-value)" }]
const chartConfig = {
value: { label: "Used", color: "var(--chart-1)" },
} satisfies ChartConfig
export function RadialChartText() {
return (
Value in the middle
A single percentage
)
}
```
4. Update the import paths to match your project.
## Usage
```tsx
import { RadialChartText } from "@/components/charts/radial-chart-text"
```
```tsx
```
Set the value in `chartData` and keep the `domain` on `PolarAngleAxis` at your maximum. Update the percentage and caption in the center overlay, and change the color in `chartConfig`.
## Notes
The center text is hard-coded, not computed from the data, and there is no tooltip.
**React Native, SwiftUI, Jetpack Compose**
```tsx title="uniwind/components/charts/radial-chart-text.tsx"
import { View } from "react-native"
import {
Card,
CardContent,
CardDescription,
CardHeader,
CardTitle,
} from "@/components/ui/card"
import {
type ChartConfig,
ChartContainer,
PolarAngleAxis,
RadialBar,
RadialBarChart,
} from "@/components/ui/chart"
import { Text } from "@/components/ui/text"
const chartData = [{ name: "value", value: 72 }]
const chartConfig = {
value: { label: "Used", color: "chart-1" },
} satisfies ChartConfig
export function RadialChartText() {
return (
Value in the middle
A single percentage
72%
cloud storage used
)
}
```
```swift title="swift/Charts/RadialChartText.swift"
import SwiftUI
private let chartConfig: ChartConfig = [
"value": .init("Used", color: EsuissColor.chart1),
]
public struct RadialChartText: View {
public init() {}
public var body: some View {
Card(.filled, size: .sm) {
CardHeader("Value in the middle", description: "A single percentage")
CardContent {
ChartContainer(config: chartConfig) {
RadialBarChart(
[RadialBar("value", value: 72)],
domain: 0...100,
innerRadius: 0.72,
outerRadius: 1,
barSize: 16,
startAngle: .degrees(0),
endAngle: .degrees(360),
rounded: true,
track: .tint
)
.overlay(alignment: .center) {
VStack(spacing: 0) {
Text(verbatim: "72%")
.textStyle(.xl3, weight: .semibold)
.monospacedDigit()
Text("cloud storage used")
.textStyle(.xs)
.foregroundStyle(EsuissColor.mutedForeground)
}
.multilineTextAlignment(.center)
}
}
.frame(height: 208)
.accessibilityElement(children: .ignore)
.accessibilityLabel(Text("Value in the middle"))
.accessibilityValue(Text("72% cloud storage used"))
}
}
}
}
```
```kt title="kotlin/charts/RadialChartText.kt"
package com.esuiss.ui.charts
import androidx.compose.foundation.layout.Box
import androidx.compose.foundation.layout.Column
import androidx.compose.foundation.layout.fillMaxWidth
import androidx.compose.foundation.layout.height
import androidx.compose.foundation.text.BasicText
import androidx.compose.runtime.Composable
import androidx.compose.ui.Alignment
import androidx.compose.ui.Modifier
import androidx.compose.ui.semantics.clearAndSetSemantics
import androidx.compose.ui.text.font.FontWeight
import androidx.compose.ui.unit.dp
import com.esuiss.ui.components.Card
import com.esuiss.ui.components.CardContent
import com.esuiss.ui.components.CardHeader
import com.esuiss.ui.components.CardSize
import com.esuiss.ui.components.CardVariant
import com.esuiss.ui.components.ChartConfig
import com.esuiss.ui.components.ChartConfigItem
import com.esuiss.ui.components.ChartContainer
import com.esuiss.ui.components.RadialBarChart
import com.esuiss.ui.components.chartColor
import com.esuiss.ui.theme.EsuissTheme
import com.esuiss.ui.theme.Typography
private class RadialTextReading(val value: Double)
private val chartData = listOf(RadialTextReading(72.0))
private val chartConfig = ChartConfig(
"value" to ChartConfigItem("Used") { chart1 },
)
@Composable
fun RadialChartText(modifier: Modifier = Modifier) {
val colors = EsuissTheme.colors
Card(modifier, variant = CardVariant.Filled, size = CardSize.Sm) {
CardHeader("Value in the middle", description = "A single percentage")
CardContent {
Box(
Modifier
.fillMaxWidth()
.height(208.dp),
) {
ChartContainer(chartConfig, Modifier.matchParentSize()) {
val color = chartColor("value")
RadialBarChart(
chartData,
innerRadius = 0.72f,
outerRadius = 1f,
startAngle = 90f,
endAngle = -270f,
barSize = 16.dp,
accessibilityLabel = "Value in the middle, 72% cloud storage used",
) {
PolarAngleAxis(0.0..100.0)
RadialBar("value", value = { it.value }, cornerRadius = 20.dp, background = color.copy(alpha = color.alpha * 0.22f))
}
}
Column(
Modifier
.align(Alignment.Center)
.clearAndSetSemantics {},
horizontalAlignment = Alignment.CenterHorizontally,
) {
BasicText(
"72%",
style = Typography.xl3.copy(color = colors.foreground, fontWeight = FontWeight.SemiBold, fontFeatureSettings = "tnum"),
)
BasicText("cloud storage used", style = Typography.xs.copy(color = colors.mutedForeground))
}
}
}
}
}
```
A `RadialBarChart` drawn as a full circle, with a single value on a 0 to 100 `PolarAngleAxis` over a tinted track. The percentage and caption are `Text` layered in the middle. Nothing is interactive.
## Installation
**React Native**
```bash title="Terminal"
npx shadcn@latest add @esuiss-rn/radial-chart-text
```
See [Installation](https://ui.suiss.app/docs/installation) for the `components.json` setup. Or use the suiss/ui CLI:
```bash title="Terminal"
npx @esuiss/ui@latest add radial-chart-text
```
**SwiftUI**
```bash title="Terminal"
npx @esuiss/ui@latest add radial-chart-text --platform swift
```
**Jetpack Compose**
```bash title="Terminal"
npx @esuiss/ui@latest add radial-chart-text --platform kotlin
```
The CLI also adds what it builds on: [Card](https://ui.suiss.app/docs/components/card), [Chart](https://ui.suiss.app/docs/components/chart), [Text](https://ui.suiss.app/docs/components/text).
### Manual
**React Native**
**Uniwind**
1. Add the pieces it builds on: [Card](https://ui.suiss.app/docs/components/card), [Chart](https://ui.suiss.app/docs/components/chart), [Text](https://ui.suiss.app/docs/components/text).
2. Copy the source into `components/charts/radial-chart-text.tsx`:
- `uniwind/components/charts/radial-chart-text.tsx`: shown above
3. Update the import paths to match your project.
**NativeWind**
1. Add the pieces it builds on: [Card](https://ui.suiss.app/docs/components/card), [Chart](https://ui.suiss.app/docs/components/chart), [Text](https://ui.suiss.app/docs/components/text).
2. Copy the source into `components/charts/radial-chart-text.tsx`:
```tsx title="nativewind/components/charts/radial-chart-text.tsx"
import { View } from "react-native"
import {
Card,
CardContent,
CardDescription,
CardHeader,
CardTitle,
} from "@/components/ui/card"
import {
type ChartConfig,
ChartContainer,
PolarAngleAxis,
RadialBar,
RadialBarChart,
} from "@/components/ui/chart"
import { Text } from "@/components/ui/text"
const chartData = [{ name: "value", value: 72 }]
const chartConfig = {
value: { label: "Used", color: "chart-1" },
} satisfies ChartConfig
export function RadialChartText() {
return (
Value in the middle
A single percentage
72%
cloud storage used
)
}
```
3. Update the import paths to match your project.
**StyleSheet**
1. Add the pieces it builds on: [Card](https://ui.suiss.app/docs/components/card), [Chart](https://ui.suiss.app/docs/components/chart), [Text](https://ui.suiss.app/docs/components/text).
2. Copy the source into `components/charts/radial-chart-text.tsx`:
```tsx title="stylesheet/components/charts/radial-chart-text.tsx"
import { StyleSheet, View } from "react-native"
import {
Card,
CardContent,
CardDescription,
CardHeader,
CardTitle,
} from "@/components/ui/card"
import {
type ChartConfig,
ChartContainer,
PolarAngleAxis,
RadialBar,
RadialBarChart,
} from "@/components/ui/chart"
import { Text } from "@/components/ui/text"
import { fontSize, useTheme } from "@/components/ui/theme"
const chartData = [{ name: "value", value: 72 }]
const chartConfig = {
value: { label: "Used", color: "chart-1" },
} satisfies ChartConfig
const styles = StyleSheet.create({
overlay: {
...StyleSheet.absoluteFill,
alignItems: "center",
justifyContent: "center",
},
value: {
...fontSize["3xl"],
fontWeight: "600",
letterSpacing: -0.75,
fontVariant: ["tabular-nums"],
},
caption: { ...fontSize.xs },
chart: { height: 208 },
})
export function RadialChartText() {
const { colors } = useTheme()
return (
Value in the middle
A single percentage
72%
cloud storage used
)
}
```
3. Update the import paths to match your project.
**SwiftUI**
1. Target iOS 17 or later.
2. Copy the theme files every view uses:
- `swift/Theme/Theme.swift`: [source](https://github.com/e-suiss/ui/blob/main/packages/mobile/swiftui/Sources/EsuissUI/Theme/Theme.swift)
- `swift/Theme/Tokens.swift`: [source](https://github.com/e-suiss/ui/blob/main/packages/mobile/swiftui/Sources/EsuissUI/Theme/Tokens.swift)
3. Copy the source and every file it uses:
- `swift/Charts/RadialChartText.swift`: shown above
- `swift/Components/Card.swift`: see [Card](https://ui.suiss.app/docs/components/card.md)
- `swift/Components/Chart.swift`: see [Chart](https://ui.suiss.app/docs/components/chart.md)
- `swift/Components/Haptics.swift`: see [Haptics](https://ui.suiss.app/docs/components/haptics.md)
- `swift/Components/Item.swift`: see [Item](https://ui.suiss.app/docs/components/item.md)
- `swift/Components/Separator.swift`: see [Separator](https://ui.suiss.app/docs/components/separator.md)
- `swift/Components/TextVariant.swift`: [source](https://github.com/e-suiss/ui/blob/main/packages/mobile/swiftui/Sources/EsuissUI/Components/TextVariant.swift)
4. Add the files to your app target.
**Jetpack Compose**
1. Set `minSdk` to 24 or higher and add the dependencies:
```kotlin title="build.gradle.kts"
implementation(platform("androidx.compose:compose-bom:2026.09.00"))
implementation("androidx.compose.foundation:foundation")
implementation("androidx.compose.ui:ui")
```
2. Copy the theme files every view uses:
- `kotlin/theme/Theme.kt`: [source](https://github.com/e-suiss/ui/blob/main/packages/mobile/kotlin/ui/src/main/kotlin/com/esuiss/ui/theme/Theme.kt)
- `kotlin/theme/Tokens.kt`: [source](https://github.com/e-suiss/ui/blob/main/packages/mobile/kotlin/ui/src/main/kotlin/com/esuiss/ui/theme/Tokens.kt)
3. Copy the source and every file it uses:
- `kotlin/charts/RadialChartText.kt`: shown above
- `kotlin/components/Card.kt`: see [Card](https://ui.suiss.app/docs/components/card.md)
- `kotlin/components/Chart.kt`: see [Chart](https://ui.suiss.app/docs/components/chart.md)
- `kotlin/components/Content.kt`: [source](https://github.com/e-suiss/ui/blob/main/packages/mobile/kotlin/ui/src/main/kotlin/com/esuiss/ui/components/Content.kt)
- `kotlin/components/FormSupport.kt`: [source](https://github.com/e-suiss/ui/blob/main/packages/mobile/kotlin/ui/src/main/kotlin/com/esuiss/ui/components/FormSupport.kt)
- `kotlin/components/Haptics.kt`: see [Haptics](https://ui.suiss.app/docs/components/haptics.md)
- `kotlin/components/Icon.kt`: see [Icon](https://ui.suiss.app/docs/components/icon.md)
4. Update the `com.esuiss.ui` package names to match your project.
## Usage
```tsx
import { RadialChartText } from "@/components/charts/radial-chart-text"
```
```tsx
```
Change the `value` in `chartData` (0 to 100) and the centered text to match it; the label and color live in `chartConfig`. The component takes no props.