# Radial Chart Rings
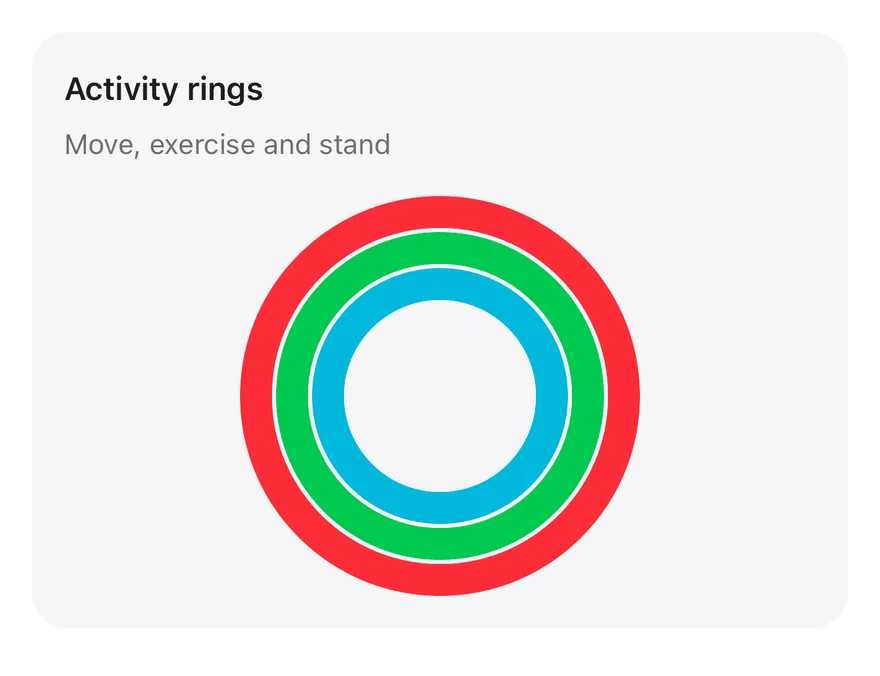
Three nested activity rings for move, exercise and stand, drawn as plain SVG circles.
Radial Chart Rings is an open-source chart from suiss/ui for React, React Native, SwiftUI and Jetpack Compose. The @esuiss/ui CLI copies its source into your project, so you own the code.
Source: https://ui.suiss.app/docs/charts/radial-chart-rings
**React**
**Example**
```tsx title="components/charts/radial-chart-rings.tsx"
"use client"
import {
Card,
CardContent,
CardDescription,
CardHeader,
CardTitle,
} from "@/components/ui/card"
const rings = [
{
key: "move",
label: "Move",
value: 720,
goal: 600,
color: "var(--color-red-500)",
},
{
key: "exercise",
label: "Exercise",
value: 62,
goal: 30,
color: "var(--color-green-500)",
},
{
key: "stand",
label: "Stand",
value: 12,
goal: 12,
color: "var(--color-cyan-500)",
},
]
const SIZE = 200
const BAR = 16
export function RadialChartRings() {
return (
Activity rings
Move, exercise and stand
)
}
```
Three nested activity rings for move, exercise and stand, each filling toward its own goal. They are drawn as plain SVG circles, so this is the lightest option when you just need static progress rings.
## Installation
### CLI
```bash title="Terminal"
npx shadcn@latest add @esuiss/radial-chart-rings
```
Works in any project with a `components.json`. See [Installation](https://ui.suiss.app/docs/installation#add-components) for the one-line registry setup. Or use the suiss/ui CLI:
```bash title="Terminal"
npx @esuiss/ui@latest add charts radial-chart-rings
```
### Manual
1. Add the pieces it builds on: [Card](https://ui.suiss.app/docs/components/card).
2. Copy the source into `components/charts/radial-chart-rings.tsx`:
```tsx title="components/charts/radial-chart-rings.tsx"
"use client"
import {
Card,
CardContent,
CardDescription,
CardHeader,
CardTitle,
} from "@/components/ui/card"
const rings = [
{
key: "move",
label: "Move",
value: 720,
goal: 600,
color: "var(--color-red-500)",
},
{
key: "exercise",
label: "Exercise",
value: 62,
goal: 30,
color: "var(--color-green-500)",
},
{
key: "stand",
label: "Stand",
value: 12,
goal: 12,
color: "var(--color-cyan-500)",
},
]
const SIZE = 200
const BAR = 16
export function RadialChartRings() {
return (
Activity rings
Move, exercise and stand
)
}
```
3. Update the import paths to match your project.
## Usage
```tsx
import { RadialChartRings } from "@/components/charts/radial-chart-rings"
```
```tsx
```
Edit the `rings` array with your labels, values, goals and colors; each ring fills by value divided by goal. Change `SIZE` and `BAR` for the overall size and ring thickness.
## Notes
The graphic is exposed as an image with a label listing each ring's value and goal. A value above its goal just shows a closed ring, with no second lap.
**React Native, SwiftUI, Jetpack Compose**
```tsx title="uniwind/components/charts/radial-chart-rings.tsx"
import { View } from "react-native"
import Svg, { Circle, G } from "react-native-svg"
import {
Card,
CardContent,
CardDescription,
CardHeader,
CardTitle,
} from "@/components/ui/card"
import { type ChartColor, ChartPalette } from "@/components/ui/chart"
const rings: {
key: string
label: string
value: number
goal: number
color: ChartColor
}[] = [
{ key: "move", label: "Move", value: 720, goal: 600, color: "red-500" },
{
key: "exercise",
label: "Exercise",
value: 62,
goal: 30,
color: "green-500",
},
{ key: "stand", label: "Stand", value: 12, goal: 12, color: "cyan-500" },
]
const SIZE = 200
const BAR = 16
export function RadialChartRings() {
return (
Activity rings
Move, exercise and stand
`${ring.label} ${ring.value} of ${ring.goal}`)
.join(", ")}
>
ring.color)}>
{(palette) => (
)}
)
}
```
```swift title="swift/Charts/RadialChartRings.swift"
import SwiftUI
private let rings: [(key: String, label: String, value: Double, goal: Double, color: Color)] = [
("move", "Move", 720, 600, Palette.red500),
("exercise", "Exercise", 62, 30, Palette.green500),
("stand", "Stand", 12, 12, Palette.cyan500),
]
private let size: CGFloat = 200
private let bar: CGFloat = 16
public struct RadialChartRings: View {
public init() {}
public var body: some View {
Card(.filled, size: .sm) {
CardHeader("Activity rings", description: "Move, exercise and stand")
CardContent {
ZStack {
ForEach(rings.indices, id: \.self) { index in
let ring = rings[index]
let radius = size / 2 - bar / 2 - CGFloat(index) * (bar + 2)
Circle()
.stroke(ring.color.opacity(0.22), lineWidth: bar)
.frame(width: radius * 2, height: radius * 2)
Circle()
.trim(from: 0, to: min(1, ring.value / ring.goal))
.stroke(ring.color, style: StrokeStyle(lineWidth: bar, lineCap: .round))
.rotationEffect(.degrees(-90))
.frame(width: radius * 2, height: radius * 2)
}
}
.frame(width: size, height: size)
.frame(maxWidth: .infinity)
.accessibilityElement(children: .ignore)
.accessibilityLabel(Text(verbatim: rings.map { "\($0.label) \(Int($0.value)) of \(Int($0.goal))" }.joined(separator: ", ")))
}
}
}
}
```
```kt title="kotlin/charts/RadialChartRings.kt"
package com.esuiss.ui.charts
import androidx.compose.foundation.Canvas
import androidx.compose.foundation.layout.Box
import androidx.compose.foundation.layout.fillMaxWidth
import androidx.compose.foundation.layout.size
import androidx.compose.runtime.Composable
import androidx.compose.ui.Alignment
import androidx.compose.ui.Modifier
import androidx.compose.ui.geometry.Offset
import androidx.compose.ui.geometry.Size
import androidx.compose.ui.graphics.Color
import androidx.compose.ui.graphics.StrokeCap
import androidx.compose.ui.graphics.drawscope.DrawScope
import androidx.compose.ui.graphics.drawscope.Stroke
import androidx.compose.ui.semantics.clearAndSetSemantics
import androidx.compose.ui.semantics.contentDescription
import androidx.compose.ui.unit.Dp
import androidx.compose.ui.unit.dp
import com.esuiss.ui.components.Card
import com.esuiss.ui.components.CardContent
import com.esuiss.ui.components.CardHeader
import com.esuiss.ui.components.CardSize
import com.esuiss.ui.components.CardVariant
import com.esuiss.ui.theme.Colors
import com.esuiss.ui.theme.EsuissTheme
import com.esuiss.ui.theme.Palette
import kotlin.math.min
private class RadialRingsRing(val label: String, val value: Double, val goal: Double, val color: Colors.() -> Color)
private val rings = listOf(
RadialRingsRing("Move", 720.0, 600.0) { Palette.red500 },
RadialRingsRing("Exercise", 62.0, 30.0) { Palette.green500 },
RadialRingsRing("Stand", 12.0, 12.0) { Palette.cyan500 },
)
internal fun DrawScope.drawActivityRing(color: Color, radius: Float, bar: Float, progress: Float) {
val center = Offset(size.width / 2, size.height / 2)
val topLeft = Offset(center.x - radius, center.y - radius)
val arc = Size(radius * 2, radius * 2)
drawCircle(color.copy(alpha = color.alpha * 0.22f), radius, center, style = Stroke(bar))
if (progress > 0.001f) {
drawArc(color, -90f, 360f * progress, false, topLeft, arc, style = Stroke(bar, cap = StrokeCap.Round))
}
}
@Composable
fun RadialChartRings(modifier: Modifier = Modifier) {
val colors = EsuissTheme.colors
Card(modifier, variant = CardVariant.Filled, size = CardSize.Sm) {
CardHeader("Activity rings", description = "Move, exercise and stand")
CardContent {
Box(Modifier.fillMaxWidth(), contentAlignment = Alignment.Center) {
RingsCanvas(
values = rings.map { min(1.0, it.value / it.goal).toFloat() },
colors = rings.map { it.color(colors) },
size = 200.dp,
bar = 16.dp,
gap = 2.dp,
modifier = Modifier.clearAndSetSemantics {
contentDescription = rings.joinToString(", ") { "${it.label} ${it.value.toInt()} of ${it.goal.toInt()}" }
},
)
}
}
}
}
@Composable
internal fun RingsCanvas(values: List, colors: List, size: Dp, bar: Dp, gap: Dp, modifier: Modifier = Modifier) {
Canvas(modifier.size(size)) {
val stroke = bar.toPx()
values.forEachIndexed { index, progress ->
val radius = this.size.width / 2 - stroke / 2 - index * (stroke + gap.toPx())
drawActivityRing(colors[index], radius, stroke, progress.coerceIn(0f, 1f))
}
}
}
```
Three rings drawn with `Svg` circles colored through `ChartPalette`. Each entry in `rings` has a value and a goal, and the filled arc is capped at a full circle. The whole graphic is one accessible image whose label lists each ring's value and goal. Nothing is interactive.
## Installation
**React Native**
```bash title="Terminal"
npx shadcn@latest add @esuiss-rn/radial-chart-rings
```
See [Installation](https://ui.suiss.app/docs/installation) for the `components.json` setup. Or use the suiss/ui CLI:
```bash title="Terminal"
npx @esuiss/ui@latest add radial-chart-rings
```
**SwiftUI**
```bash title="Terminal"
npx @esuiss/ui@latest add radial-chart-rings --platform swift
```
**Jetpack Compose**
```bash title="Terminal"
npx @esuiss/ui@latest add radial-chart-rings --platform kotlin
```
The CLI also adds what it builds on: [Card](https://ui.suiss.app/docs/components/card), [Chart](https://ui.suiss.app/docs/components/chart).
### Manual
**React Native**
**Uniwind**
1. Install the dependencies:
```bash title="Terminal"
npx expo install react-native-svg
```
2. Add the pieces it builds on: [Card](https://ui.suiss.app/docs/components/card), [Chart](https://ui.suiss.app/docs/components/chart).
3. Copy the source into `components/charts/radial-chart-rings.tsx`:
- `uniwind/components/charts/radial-chart-rings.tsx`: shown above
4. Update the import paths to match your project.
**NativeWind**
1. Install the dependencies:
```bash title="Terminal"
npx expo install react-native-svg
```
2. Add the pieces it builds on: [Card](https://ui.suiss.app/docs/components/card), [Chart](https://ui.suiss.app/docs/components/chart).
3. Copy the source into `components/charts/radial-chart-rings.tsx`:
```tsx title="nativewind/components/charts/radial-chart-rings.tsx"
import { View } from "react-native"
import Svg, { Circle, G } from "react-native-svg"
import {
Card,
CardContent,
CardDescription,
CardHeader,
CardTitle,
} from "@/components/ui/card"
import { type ChartColor, ChartPalette } from "@/components/ui/chart"
const rings: {
key: string
label: string
value: number
goal: number
color: ChartColor
}[] = [
{ key: "move", label: "Move", value: 720, goal: 600, color: "red-500" },
{
key: "exercise",
label: "Exercise",
value: 62,
goal: 30,
color: "green-500",
},
{ key: "stand", label: "Stand", value: 12, goal: 12, color: "cyan-500" },
]
const SIZE = 200
const BAR = 16
export function RadialChartRings() {
return (
Activity rings
Move, exercise and stand
`${ring.label} ${ring.value} of ${ring.goal}`)
.join(", ")}
>
ring.color)}>
{(palette) => (
)}
)
}
```
4. Update the import paths to match your project.
**StyleSheet**
1. Install the dependencies:
```bash title="Terminal"
npx expo install react-native-svg
```
2. Add the pieces it builds on: [Card](https://ui.suiss.app/docs/components/card), [Chart](https://ui.suiss.app/docs/components/chart).
3. Copy the source into `components/charts/radial-chart-rings.tsx`:
```tsx title="stylesheet/components/charts/radial-chart-rings.tsx"
import { View } from "react-native"
import Svg, { Circle, G } from "react-native-svg"
import {
Card,
CardContent,
CardDescription,
CardHeader,
CardTitle,
} from "@/components/ui/card"
import { type ChartColor, ChartPalette } from "@/components/ui/chart"
const rings: {
key: string
label: string
value: number
goal: number
color: ChartColor
}[] = [
{ key: "move", label: "Move", value: 720, goal: 600, color: "red-500" },
{
key: "exercise",
label: "Exercise",
value: 62,
goal: 30,
color: "green-500",
},
{ key: "stand", label: "Stand", value: 12, goal: 12, color: "cyan-500" },
]
const SIZE = 200
const BAR = 16
export function RadialChartRings() {
return (
Activity rings
Move, exercise and stand
`${ring.label} ${ring.value} of ${ring.goal}`)
.join(", ")}
>
ring.color)}>
{(palette) => (
)}
)
}
```
4. Update the import paths to match your project.
**SwiftUI**
1. Target iOS 17 or later.
2. Copy the theme files every view uses:
- `swift/Theme/Theme.swift`: [source](https://github.com/e-suiss/ui/blob/main/packages/mobile/swiftui/Sources/EsuissUI/Theme/Theme.swift)
- `swift/Theme/Tokens.swift`: [source](https://github.com/e-suiss/ui/blob/main/packages/mobile/swiftui/Sources/EsuissUI/Theme/Tokens.swift)
3. Copy the source and every file it uses:
- `swift/Charts/RadialChartRings.swift`: shown above
- `swift/Components/Card.swift`: see [Card](https://ui.suiss.app/docs/components/card.md)
4. Add the files to your app target.
**Jetpack Compose**
1. Set `minSdk` to 24 or higher and add the dependencies:
```kotlin title="build.gradle.kts"
implementation(platform("androidx.compose:compose-bom:2026.09.00"))
implementation("androidx.compose.foundation:foundation")
implementation("androidx.compose.ui:ui")
```
2. Copy the theme files every view uses:
- `kotlin/theme/Theme.kt`: [source](https://github.com/e-suiss/ui/blob/main/packages/mobile/kotlin/ui/src/main/kotlin/com/esuiss/ui/theme/Theme.kt)
- `kotlin/theme/Tokens.kt`: [source](https://github.com/e-suiss/ui/blob/main/packages/mobile/kotlin/ui/src/main/kotlin/com/esuiss/ui/theme/Tokens.kt)
3. Copy the source and every file it uses:
- `kotlin/charts/RadialChartRings.kt`: shown above
- `kotlin/components/Card.kt`: see [Card](https://ui.suiss.app/docs/components/card.md)
- `kotlin/components/Content.kt`: [source](https://github.com/e-suiss/ui/blob/main/packages/mobile/kotlin/ui/src/main/kotlin/com/esuiss/ui/components/Content.kt)
4. Update the `com.esuiss.ui` package names to match your project.
## Usage
```tsx
import { RadialChartRings } from "@/components/charts/radial-chart-rings"
```
```tsx
```
Replace the values, goals and colors in `rings`, and change `SIZE` and `BAR` to resize the rings. The component takes no props.