# Area Chart Sparkline
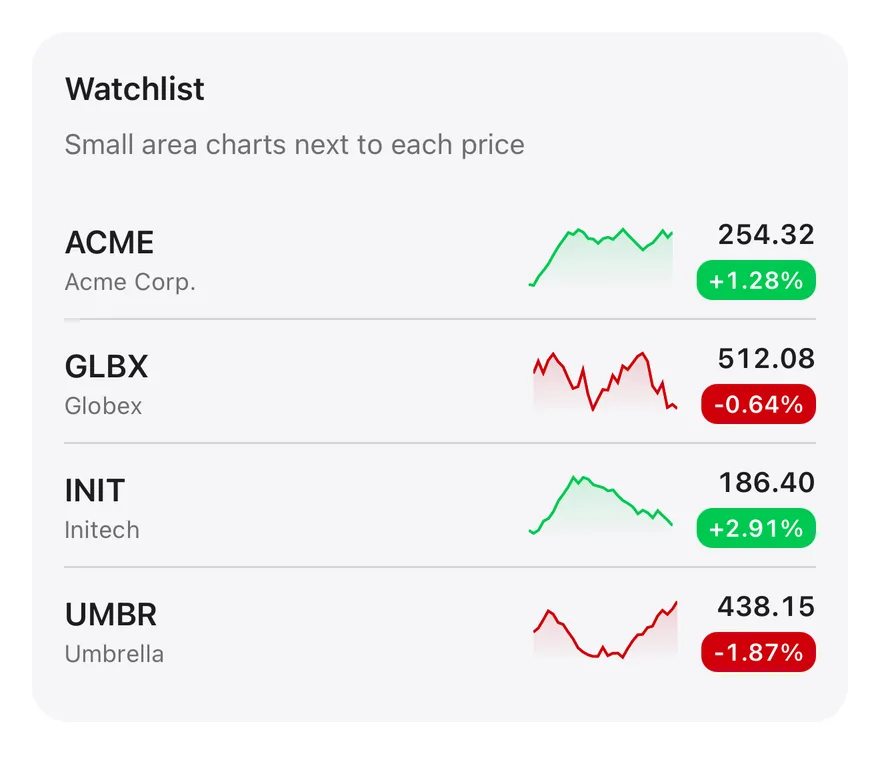
A watchlist with a tiny gradient area chart beside each price, colored by whether the stock is rising or falling.
Area Chart Sparkline is an open-source chart from suiss/ui for React, React Native, SwiftUI and Jetpack Compose. The @esuiss/ui CLI copies its source into your project, so you own the code.
Source: https://ui.suiss.app/docs/charts/area-chart-sparkline
**React**
**Example**
```tsx title="components/charts/area-chart-sparkline.tsx"
"use client"
import * as React from "react"
import { Area, AreaChart, YAxis } from "recharts"
import {
Card,
CardContent,
CardDescription,
CardHeader,
CardTitle,
} from "@/components/ui/card"
import { type ChartConfig, ChartContainer } from "@/components/ui/chart"
const stocks = [
{ symbol: "ACME", name: "Acme Corp.", price: 254.32, change: 1.28, seed: 41 },
{ symbol: "GLBX", name: "Globex", price: 512.08, change: -0.64, seed: 52 },
{ symbol: "INIT", name: "Initech", price: 186.4, change: 2.91, seed: 63 },
{ symbol: "UMBR", name: "Umbrella", price: 438.15, change: -1.87, seed: 74 },
]
const chartConfig = {
up: { label: "Rising", color: "var(--color-green-500)" },
down: { label: "Falling", color: "var(--destructive)" },
} satisfies ChartConfig
const priceFormat = new Intl.NumberFormat("en-US", {
minimumFractionDigits: 2,
maximumFractionDigits: 2,
})
const changeFormat = new Intl.NumberFormat("en-US", {
minimumFractionDigits: 2,
maximumFractionDigits: 2,
signDisplay: "always",
})
function series(seed: number, rising: boolean) {
let state = seed
let value = 100
return Array.from({ length: 30 }, (_, index) => {
state = (state * 16807) % 2147483647
value *= 1 + ((state - 1) / 2147483646 - (rising ? 0.44 : 0.56)) * 0.02
return { index, value }
})
}
function Sparkline({ seed, rising }: { seed: number; rising: boolean }) {
const key = rising ? "up" : "down"
const id = React.useId()
return (
)
}
export function AreaChartSparkline() {
return (
Watchlist
Small area charts next to each price
{stocks.map((stock) => {
const rising = stock.change >= 0
return (
-
{stock.symbol}
{stock.name}
{priceFormat.format(stock.price)}
{changeFormat.format(stock.change)}%
)
})}
)
}
```
A watchlist where each row pairs a stock's name and price with a tiny gradient area chart, tinted green when rising and red when falling. Use sparklines like these inside lists and tables where a full chart would be too much.
## Installation
### CLI
```bash title="Terminal"
npx shadcn@latest add @esuiss/area-chart-sparkline
```
Works in any project with a `components.json`. See [Installation](https://ui.suiss.app/docs/installation#add-components) for the one-line registry setup. Or use the suiss/ui CLI:
```bash title="Terminal"
npx @esuiss/ui@latest add charts area-chart-sparkline
```
### Manual
1. Install the dependencies:
```bash title="Terminal"
npm install recharts
```
2. Add the pieces it builds on: [Card](https://ui.suiss.app/docs/components/card), [Chart](https://ui.suiss.app/docs/components/chart).
3. Copy the source into `components/charts/area-chart-sparkline.tsx`:
```tsx title="components/charts/area-chart-sparkline.tsx"
"use client"
import * as React from "react"
import { Area, AreaChart, YAxis } from "recharts"
import {
Card,
CardContent,
CardDescription,
CardHeader,
CardTitle,
} from "@/components/ui/card"
import { type ChartConfig, ChartContainer } from "@/components/ui/chart"
const stocks = [
{ symbol: "ACME", name: "Acme Corp.", price: 254.32, change: 1.28, seed: 41 },
{ symbol: "GLBX", name: "Globex", price: 512.08, change: -0.64, seed: 52 },
{ symbol: "INIT", name: "Initech", price: 186.4, change: 2.91, seed: 63 },
{ symbol: "UMBR", name: "Umbrella", price: 438.15, change: -1.87, seed: 74 },
]
const chartConfig = {
up: { label: "Rising", color: "var(--color-green-500)" },
down: { label: "Falling", color: "var(--destructive)" },
} satisfies ChartConfig
const priceFormat = new Intl.NumberFormat("en-US", {
minimumFractionDigits: 2,
maximumFractionDigits: 2,
})
const changeFormat = new Intl.NumberFormat("en-US", {
minimumFractionDigits: 2,
maximumFractionDigits: 2,
signDisplay: "always",
})
function series(seed: number, rising: boolean) {
let state = seed
let value = 100
return Array.from({ length: 30 }, (_, index) => {
state = (state * 16807) % 2147483647
value *= 1 + ((state - 1) / 2147483646 - (rising ? 0.44 : 0.56)) * 0.02
return { index, value }
})
}
function Sparkline({ seed, rising }: { seed: number; rising: boolean }) {
const key = rising ? "up" : "down"
const id = React.useId()
return (
)
}
export function AreaChartSparkline() {
return (
Watchlist
Small area charts next to each price
{stocks.map((stock) => {
const rising = stock.change >= 0
return (
-
{stock.symbol}
{stock.name}
{priceFormat.format(stock.price)}
{changeFormat.format(stock.change)}%
)
})}
)
}
```
4. Update the import paths to match your project.
## Usage
```tsx
import { AreaChartSparkline } from "@/components/charts/area-chart-sparkline"
```
```tsx
```
Replace the `stocks` array and the demo `series` generator with your own symbols and price history. The tint follows the sign of each row's `change`, and the two colors live in `chartConfig`. Resize the sparkline through the class names on its `ChartContainer`.
## Notes
Sparklines are hidden from assistive technology and have no tooltip or keyboard support, so keep the price and percentage text next to them. Animation is off so long lists render without motion.
**React Native, SwiftUI, Jetpack Compose**
```tsx title="uniwind/components/charts/area-chart-sparkline.tsx"
import { cn } from "cn"
import { View } from "react-native"
import {
Card,
CardContent,
CardDescription,
CardHeader,
CardTitle,
} from "@/components/ui/card"
import {
Area,
AreaChart,
type ChartConfig,
ChartContainer,
YAxis,
} from "@/components/ui/chart"
import { Text } from "@/components/ui/text"
const stocks = [
{ symbol: "ACME", name: "Acme Corp.", price: 254.32, change: 1.28, seed: 41 },
{ symbol: "GLBX", name: "Globex", price: 512.08, change: -0.64, seed: 52 },
{ symbol: "INIT", name: "Initech", price: 186.4, change: 2.91, seed: 63 },
{ symbol: "UMBR", name: "Umbrella", price: 438.15, change: -1.87, seed: 74 },
]
const chartConfig = {
up: { label: "Rising", color: "green-500" },
down: { label: "Falling", color: "destructive" },
} satisfies ChartConfig
function formatPrice(value: number, signed = false) {
const sign = signed && value >= 0 ? "+" : ""
try {
return `${sign}${new Intl.NumberFormat("en-US", {
minimumFractionDigits: 2,
maximumFractionDigits: 2,
}).format(value)}`
} catch {
const [whole = "0", fraction = "00"] = value.toFixed(2).split(".")
return `${sign}${whole.replace(/\B(?=(\d{3})+(?!\d))/g, ",")}.${fraction}`
}
}
function series(seed: number, rising: boolean) {
let state = seed
let value = 100
return Array.from({ length: 30 }, (_, index) => {
state = (state * 16807) % 2147483647
value *= 1 + ((state - 1) / 2147483646 - (rising ? 0.44 : 0.56)) * 0.02
return { index, value }
})
}
function Sparkline({ seed, rising }: { seed: number; rising: boolean }) {
const color = chartConfig[rising ? "up" : "down"].color
return (
)
}
export function AreaChartSparkline() {
return (
Watchlist
Small area charts next to each price
{stocks.map((stock, index) => {
const rising = stock.change >= 0
return (
0 && "border-t"
)}
>
{stock.symbol}
{stock.name}
{formatPrice(stock.price)}
{formatPrice(stock.change, true)}%
)
})}
)
}
```
```swift title="swift/Charts/AreaChartSparkline.swift"
import Charts
import SwiftUI
private let stocks: [(symbol: String, name: String, price: Double, change: Double, seed: Int)] = [
("ACME", "Acme Corp.", 254.32, 1.28, 41),
("GLBX", "Globex", 512.08, -0.64, 52),
("INIT", "Initech", 186.4, 2.91, 63),
("UMBR", "Umbrella", 438.15, -1.87, 74),
]
private let chartConfig: ChartConfig = [
"up": .init("Rising", color: Palette.green500),
"down": .init("Falling", color: EsuissColor.destructive),
]
private func series(_ seed: Int, rising: Bool) -> [Double] {
var state = seed
var value = 100.0
return (0..<30).map { _ in
state = (state * 16807) % 2147483647
value *= 1 + (Double(state - 1) / 2147483646 - (rising ? 0.44 : 0.56)) * 0.02
return value
}
}
private struct Sparkline: View {
let seed: Int
let rising: Bool
var body: some View {
let values = series(seed, rising: rising)
let color = chartConfig.color(rising ? "up" : "down")
ChartContainer(config: chartConfig) {
Chart {
ForEach(values.indices, id: \.self) { index in
AreaMark(x: .value("Day", index), yStart: .value("Base", values.min() ?? 0), yEnd: .value("Value", values[index]))
.interpolationMethod(.linear)
.foregroundStyle(LinearGradient(colors: [color.opacity(0.25), color.opacity(0.02)], startPoint: .top, endPoint: .bottom))
LineMark(x: .value("Day", index), y: .value("Value", values[index]))
.interpolationMethod(.linear)
.lineStyle(StrokeStyle(lineWidth: 1.5, lineCap: .round, lineJoin: .round))
.foregroundStyle(color)
}
}
.chartXScale(domain: 0...(values.count - 1))
.chartYScale(domain: (values.min() ?? 0)...(values.max() ?? 1))
.chartXAxis(.hidden)
.chartYAxis(.hidden)
.padding(.vertical, 2)
}
.frame(width: 72, height: 32)
.accessibilityHidden(true)
}
}
public struct AreaChartSparkline: View {
@Environment(\.locale) private var locale
@Environment(\.colorScheme) private var colorScheme
public init() {}
public var body: some View {
Card(.filled, size: .sm) {
CardHeader("Watchlist", description: "Small area charts next to each price")
CardContent {
VStack(spacing: 0) {
ForEach(stocks.indices, id: \.self) { index in
if index > 0 {
EsuissColor.border.frame(height: 1)
}
row(stocks[index])
}
}
}
}
}
private func row(_ stock: (symbol: String, name: String, price: Double, change: Double, seed: Int)) -> some View {
let rising = stock.change >= 0
return HStack(spacing: 12) {
VStack(alignment: .leading, spacing: 0) {
Text(verbatim: stock.symbol)
.textStyle(.base, weight: .semibold)
Text(verbatim: stock.name)
.textStyle(.xs)
.foregroundStyle(EsuissColor.mutedForeground)
.lineLimit(1)
}
.frame(maxWidth: .infinity, alignment: .leading)
Sparkline(seed: stock.seed, rising: rising)
VStack(alignment: .trailing, spacing: 3) {
Text(stock.price, format: .number.precision(.fractionLength(2)).locale(locale))
.textStyle(.sm, weight: .semibold)
.monospacedDigit()
Text("\(stock.change, format: .number.precision(.fractionLength(2)).sign(strategy: .always()).locale(locale))%")
.textStyle(.xs, weight: .semibold)
.monospacedDigit()
.foregroundStyle(colorScheme == .dark ? EsuissColor.background : EsuissColor.primaryForeground)
.padding(.horizontal, 6)
.padding(.vertical, 2)
.frame(minWidth: 52, alignment: .trailing)
.background(rising ? Palette.green500 : EsuissColor.destructive, in: RoundedRectangle(cornerRadius: Radius.md, style: .continuous))
}
}
.padding(.vertical, 9)
.accessibilityElement(children: .combine)
}
}
```
```kt title="kotlin/charts/AreaChartSparkline.kt"
package com.esuiss.ui.charts
import androidx.compose.foundation.background
import androidx.compose.foundation.layout.Arrangement
import androidx.compose.foundation.layout.Column
import androidx.compose.foundation.layout.Row
import androidx.compose.foundation.layout.fillMaxWidth
import androidx.compose.foundation.layout.padding
import androidx.compose.foundation.layout.size
import androidx.compose.foundation.layout.widthIn
import androidx.compose.foundation.shape.RoundedCornerShape
import androidx.compose.foundation.text.BasicText
import androidx.compose.runtime.Composable
import androidx.compose.runtime.remember
import androidx.compose.ui.Alignment
import androidx.compose.ui.Modifier
import androidx.compose.ui.semantics.clearAndSetSemantics
import androidx.compose.ui.text.font.FontWeight
import androidx.compose.ui.text.style.TextAlign
import androidx.compose.ui.text.style.TextOverflow
import androidx.compose.ui.unit.dp
import com.esuiss.ui.components.AreaChart
import com.esuiss.ui.components.Card
import com.esuiss.ui.components.CardContent
import com.esuiss.ui.components.CardHeader
import com.esuiss.ui.components.CardSize
import com.esuiss.ui.components.CardVariant
import com.esuiss.ui.components.ChartConfig
import com.esuiss.ui.components.ChartConfigItem
import com.esuiss.ui.components.ChartContainer
import com.esuiss.ui.components.ChartFill
import com.esuiss.ui.components.ChartMargin
import com.esuiss.ui.components.Separator
import com.esuiss.ui.theme.EsuissTheme
import com.esuiss.ui.theme.Palette
import com.esuiss.ui.theme.Radius
import com.esuiss.ui.theme.Typography
import java.text.NumberFormat
import java.util.Locale
private class Stock(val symbol: String, val name: String, val price: Double, val change: Double, val seed: Long)
private class SparkPoint(val index: Int, val value: Double)
private val stocks = listOf(
Stock("ACME", "Acme Corp.", 254.32, 1.28, 41),
Stock("GLBX", "Globex", 512.08, -0.64, 52),
Stock("INIT", "Initech", 186.4, 2.91, 63),
Stock("UMBR", "Umbrella", 438.15, -1.87, 74),
)
private val chartConfig = ChartConfig(
"up" to ChartConfigItem("Rising") { Palette.green500 },
"down" to ChartConfigItem("Falling") { destructive },
)
private fun series(seed: Long, rising: Boolean): List {
var state = seed
var value = 100.0
return List(30) { index ->
state = state * 16807 % 2147483647
value *= 1 + ((state - 1) / 2147483646.0 - if (rising) 0.44 else 0.56) * 0.02
SparkPoint(index, value)
}
}
private fun twoDigits(): NumberFormat = NumberFormat.getNumberInstance(Locale.US).apply {
minimumFractionDigits = 2
maximumFractionDigits = 2
}
@Composable
private fun Sparkline(seed: Long, rising: Boolean) {
val key = if (rising) "up" else "down"
val data = remember(seed, rising) { series(seed, rising) }
ChartContainer(
chartConfig,
Modifier
.size(72.dp, 32.dp)
.clearAndSetSemantics { },
) {
AreaChart(data, margin = ChartMargin(top = 2.dp, right = 0.dp, bottom = 2.dp, left = 0.dp)) {
YAxis(hide = true, domain = data.minOf { it.value }..data.maxOf { it.value })
Area(
key,
value = { it.value },
strokeWidth = 1.5.dp,
fill = ChartFill.VerticalGradient(topAlpha = 0.25f, bottomAlpha = 0.02f),
activeDot = null,
isAnimationActive = false,
)
}
}
}
@Composable
fun AreaChartSparkline(modifier: Modifier = Modifier) {
val colors = EsuissTheme.colors
val priceFormat = remember { twoDigits() }
Card(modifier, variant = CardVariant.Filled, size = CardSize.Sm) {
CardHeader("Watchlist", description = "Small area charts next to each price")
CardContent {
stocks.forEachIndexed { index, stock ->
val rising = stock.change >= 0
if (index > 0) Separator()
Row(
Modifier
.fillMaxWidth()
.padding(vertical = 9.dp),
horizontalArrangement = Arrangement.spacedBy(12.dp),
verticalAlignment = Alignment.CenterVertically,
) {
Column(Modifier.weight(1f)) {
BasicText(stock.symbol, style = Typography.base.copy(color = colors.foreground, fontWeight = FontWeight.SemiBold))
BasicText(
stock.name,
style = Typography.xs.copy(color = colors.mutedForeground),
maxLines = 1,
overflow = TextOverflow.Ellipsis,
)
}
Sparkline(stock.seed, rising)
Column(horizontalAlignment = Alignment.End, verticalArrangement = Arrangement.spacedBy(3.dp)) {
BasicText(
priceFormat.format(stock.price),
style = Typography.sm.copy(color = colors.foreground, fontWeight = FontWeight.SemiBold, fontFeatureSettings = "tnum"),
)
BasicText(
"${if (stock.change >= 0) "+" else "-"}${priceFormat.format(kotlin.math.abs(stock.change))}%",
Modifier
.widthIn(min = 52.dp)
.background(if (rising) Palette.green500 else colors.destructive, RoundedCornerShape(Radius.md))
.padding(horizontal = 6.dp, vertical = 2.dp),
style = Typography.xs.copy(
color = if (colors.isDark) colors.background else colors.primaryForeground,
fontWeight = FontWeight.SemiBold,
fontFeatureSettings = "tnum",
textAlign = TextAlign.End,
),
)
}
}
}
}
}
}
```
Each row shows a symbol and company name, a tiny area chart without axes, the price and a colored badge with the percentage change. The sparkline turns green when the change is positive and red when it is negative, using the `up` and `down` colors in `chartConfig`. The charts are hidden from screen readers because the row text already carries the values. Each sparkline sets `isAnimationActive={false}` and draws without the enter animation.
## Installation
**React Native**
```bash title="Terminal"
npx shadcn@latest add @esuiss-rn/area-chart-sparkline
```
See [Installation](https://ui.suiss.app/docs/installation) for the `components.json` setup. Or use the suiss/ui CLI:
```bash title="Terminal"
npx @esuiss/ui@latest add area-chart-sparkline
```
**SwiftUI**
```bash title="Terminal"
npx @esuiss/ui@latest add area-chart-sparkline --platform swift
```
**Jetpack Compose**
```bash title="Terminal"
npx @esuiss/ui@latest add area-chart-sparkline --platform kotlin
```
The CLI also adds what it builds on: [Card](https://ui.suiss.app/docs/components/card), [Chart](https://ui.suiss.app/docs/components/chart), [Text](https://ui.suiss.app/docs/components/text).
### Manual
**React Native**
**Uniwind**
1. Install the dependencies:
```bash title="Terminal"
npx expo install cn
```
2. Add the pieces it builds on: [Card](https://ui.suiss.app/docs/components/card), [Chart](https://ui.suiss.app/docs/components/chart), [Text](https://ui.suiss.app/docs/components/text).
3. Copy the source into `components/charts/area-chart-sparkline.tsx`:
- `uniwind/components/charts/area-chart-sparkline.tsx`: shown above
4. Update the import paths to match your project.
**NativeWind**
1. Install the dependencies:
```bash title="Terminal"
npx expo install cn
```
2. Add the pieces it builds on: [Card](https://ui.suiss.app/docs/components/card), [Chart](https://ui.suiss.app/docs/components/chart), [Text](https://ui.suiss.app/docs/components/text).
3. Copy the source into `components/charts/area-chart-sparkline.tsx`:
```tsx title="nativewind/components/charts/area-chart-sparkline.tsx"
import { cn } from "cn"
import { View } from "react-native"
import {
Card,
CardContent,
CardDescription,
CardHeader,
CardTitle,
} from "@/components/ui/card"
import {
Area,
AreaChart,
type ChartConfig,
ChartContainer,
YAxis,
} from "@/components/ui/chart"
import { Text } from "@/components/ui/text"
const stocks = [
{ symbol: "ACME", name: "Acme Corp.", price: 254.32, change: 1.28, seed: 41 },
{ symbol: "GLBX", name: "Globex", price: 512.08, change: -0.64, seed: 52 },
{ symbol: "INIT", name: "Initech", price: 186.4, change: 2.91, seed: 63 },
{ symbol: "UMBR", name: "Umbrella", price: 438.15, change: -1.87, seed: 74 },
]
const chartConfig = {
up: { label: "Rising", color: "green-500" },
down: { label: "Falling", color: "destructive" },
} satisfies ChartConfig
function formatPrice(value: number, signed = false) {
const sign = signed && value >= 0 ? "+" : ""
try {
return `${sign}${new Intl.NumberFormat("en-US", {
minimumFractionDigits: 2,
maximumFractionDigits: 2,
}).format(value)}`
} catch {
const [whole = "0", fraction = "00"] = value.toFixed(2).split(".")
return `${sign}${whole.replace(/\B(?=(\d{3})+(?!\d))/g, ",")}.${fraction}`
}
}
function series(seed: number, rising: boolean) {
let state = seed
let value = 100
return Array.from({ length: 30 }, (_, index) => {
state = (state * 16807) % 2147483647
value *= 1 + ((state - 1) / 2147483646 - (rising ? 0.44 : 0.56)) * 0.02
return { index, value }
})
}
function Sparkline({ seed, rising }: { seed: number; rising: boolean }) {
const color = chartConfig[rising ? "up" : "down"].color
return (
)
}
export function AreaChartSparkline() {
return (
Watchlist
Small area charts next to each price
{stocks.map((stock, index) => {
const rising = stock.change >= 0
return (
0 && "border-t"
)}
>
{stock.symbol}
{stock.name}
{formatPrice(stock.price)}
{formatPrice(stock.change, true)}%
)
})}
)
}
```
4. Update the import paths to match your project.
**StyleSheet**
1. Add the pieces it builds on: [Card](https://ui.suiss.app/docs/components/card), [Chart](https://ui.suiss.app/docs/components/chart), [Text](https://ui.suiss.app/docs/components/text).
2. Copy the source into `components/charts/area-chart-sparkline.tsx`:
```tsx title="stylesheet/components/charts/area-chart-sparkline.tsx"
import { StyleSheet, View } from "react-native"
import {
Card,
CardContent,
CardDescription,
CardHeader,
CardTitle,
} from "@/components/ui/card"
import {
Area,
AreaChart,
type ChartConfig,
ChartContainer,
YAxis,
} from "@/components/ui/chart"
import { Text } from "@/components/ui/text"
import { fontSize, palette, useTheme } from "@/components/ui/theme"
const stocks = [
{ symbol: "ACME", name: "Acme Corp.", price: 254.32, change: 1.28, seed: 41 },
{ symbol: "GLBX", name: "Globex", price: 512.08, change: -0.64, seed: 52 },
{ symbol: "INIT", name: "Initech", price: 186.4, change: 2.91, seed: 63 },
{ symbol: "UMBR", name: "Umbrella", price: 438.15, change: -1.87, seed: 74 },
]
const chartConfig = {
up: { label: "Rising", color: "green-500" },
down: { label: "Falling", color: "destructive" },
} satisfies ChartConfig
const styles = StyleSheet.create({
sparkline: { height: 32, width: 72, flexShrink: 0 },
row: {
flexDirection: "row",
alignItems: "center",
gap: 12,
paddingVertical: 9,
},
name: { minWidth: 0, flex: 1 },
symbol: { ...fontSize.base, fontWeight: "600" },
company: { ...fontSize.xs },
prices: { alignItems: "flex-end", gap: 3 },
price: { ...fontSize.sm, fontWeight: "600", fontVariant: ["tabular-nums"] },
badge: {
minWidth: 52,
borderRadius: 6,
paddingHorizontal: 6,
paddingVertical: 2,
},
change: {
...fontSize.xs,
textAlign: "right",
fontWeight: "600",
fontVariant: ["tabular-nums"],
},
})
function formatPrice(value: number, signed = false) {
const sign = signed && value >= 0 ? "+" : ""
try {
return `${sign}${new Intl.NumberFormat("en-US", {
minimumFractionDigits: 2,
maximumFractionDigits: 2,
}).format(value)}`
} catch {
const [whole = "0", fraction = "00"] = value.toFixed(2).split(".")
return `${sign}${whole.replace(/\B(?=(\d{3})+(?!\d))/g, ",")}.${fraction}`
}
}
function series(seed: number, rising: boolean) {
let state = seed
let value = 100
return Array.from({ length: 30 }, (_, index) => {
state = (state * 16807) % 2147483647
value *= 1 + ((state - 1) / 2147483646 - (rising ? 0.44 : 0.56)) * 0.02
return { index, value }
})
}
function Sparkline({ seed, rising }: { seed: number; rising: boolean }) {
const color = chartConfig[rising ? "up" : "down"].color
return (
)
}
export function AreaChartSparkline() {
const { colors, isDark } = useTheme()
return (
Watchlist
Small area charts next to each price
{stocks.map((stock, index) => {
const rising = stock.change >= 0
return (
0 && {
borderTopWidth: 1,
borderColor: colors.border,
},
]}
>
{stock.symbol}
{stock.name}
{formatPrice(stock.price)}
{formatPrice(stock.change, true)}%
)
})}
)
}
```
3. Update the import paths to match your project.
**SwiftUI**
1. Target iOS 17 or later.
2. Copy the theme files every view uses:
- `swift/Theme/Theme.swift`: [source](https://github.com/e-suiss/ui/blob/main/packages/mobile/swiftui/Sources/EsuissUI/Theme/Theme.swift)
- `swift/Theme/Tokens.swift`: [source](https://github.com/e-suiss/ui/blob/main/packages/mobile/swiftui/Sources/EsuissUI/Theme/Tokens.swift)
3. Copy the source and every file it uses:
- `swift/Charts/AreaChartSparkline.swift`: shown above
- `swift/Components/Card.swift`: see [Card](https://ui.suiss.app/docs/components/card.md)
- `swift/Components/Chart.swift`: see [Chart](https://ui.suiss.app/docs/components/chart.md)
- `swift/Components/Haptics.swift`: see [Haptics](https://ui.suiss.app/docs/components/haptics.md)
- `swift/Components/Item.swift`: see [Item](https://ui.suiss.app/docs/components/item.md)
- `swift/Components/Separator.swift`: see [Separator](https://ui.suiss.app/docs/components/separator.md)
- `swift/Components/TextVariant.swift`: [source](https://github.com/e-suiss/ui/blob/main/packages/mobile/swiftui/Sources/EsuissUI/Components/TextVariant.swift)
4. Add the files to your app target.
**Jetpack Compose**
1. Set `minSdk` to 24 or higher and add the dependencies:
```kotlin title="build.gradle.kts"
implementation(platform("androidx.compose:compose-bom:2026.09.00"))
implementation("androidx.compose.foundation:foundation")
implementation("androidx.compose.ui:ui")
```
2. Copy the theme files every view uses:
- `kotlin/theme/Theme.kt`: [source](https://github.com/e-suiss/ui/blob/main/packages/mobile/kotlin/ui/src/main/kotlin/com/esuiss/ui/theme/Theme.kt)
- `kotlin/theme/Tokens.kt`: [source](https://github.com/e-suiss/ui/blob/main/packages/mobile/kotlin/ui/src/main/kotlin/com/esuiss/ui/theme/Tokens.kt)
3. Copy the source and every file it uses:
- `kotlin/charts/AreaChartSparkline.kt`: shown above
- `kotlin/components/Card.kt`: see [Card](https://ui.suiss.app/docs/components/card.md)
- `kotlin/components/Chart.kt`: see [Chart](https://ui.suiss.app/docs/components/chart.md)
- `kotlin/components/Content.kt`: [source](https://github.com/e-suiss/ui/blob/main/packages/mobile/kotlin/ui/src/main/kotlin/com/esuiss/ui/components/Content.kt)
- `kotlin/components/FormSupport.kt`: [source](https://github.com/e-suiss/ui/blob/main/packages/mobile/kotlin/ui/src/main/kotlin/com/esuiss/ui/components/FormSupport.kt)
- `kotlin/components/Haptics.kt`: see [Haptics](https://ui.suiss.app/docs/components/haptics.md)
- `kotlin/components/Icon.kt`: see [Icon](https://ui.suiss.app/docs/components/icon.md)
- `kotlin/components/Separator.kt`: see [Separator](https://ui.suiss.app/docs/components/separator.md)
4. Update the `com.esuiss.ui` package names to match your project.
## Usage
```tsx
import { AreaChartSparkline } from "@/components/charts/area-chart-sparkline"
```
```tsx
```
Replace the `stocks` array with your own symbols, prices and changes, and swap the generated `series` data for real price history. The component takes no props.